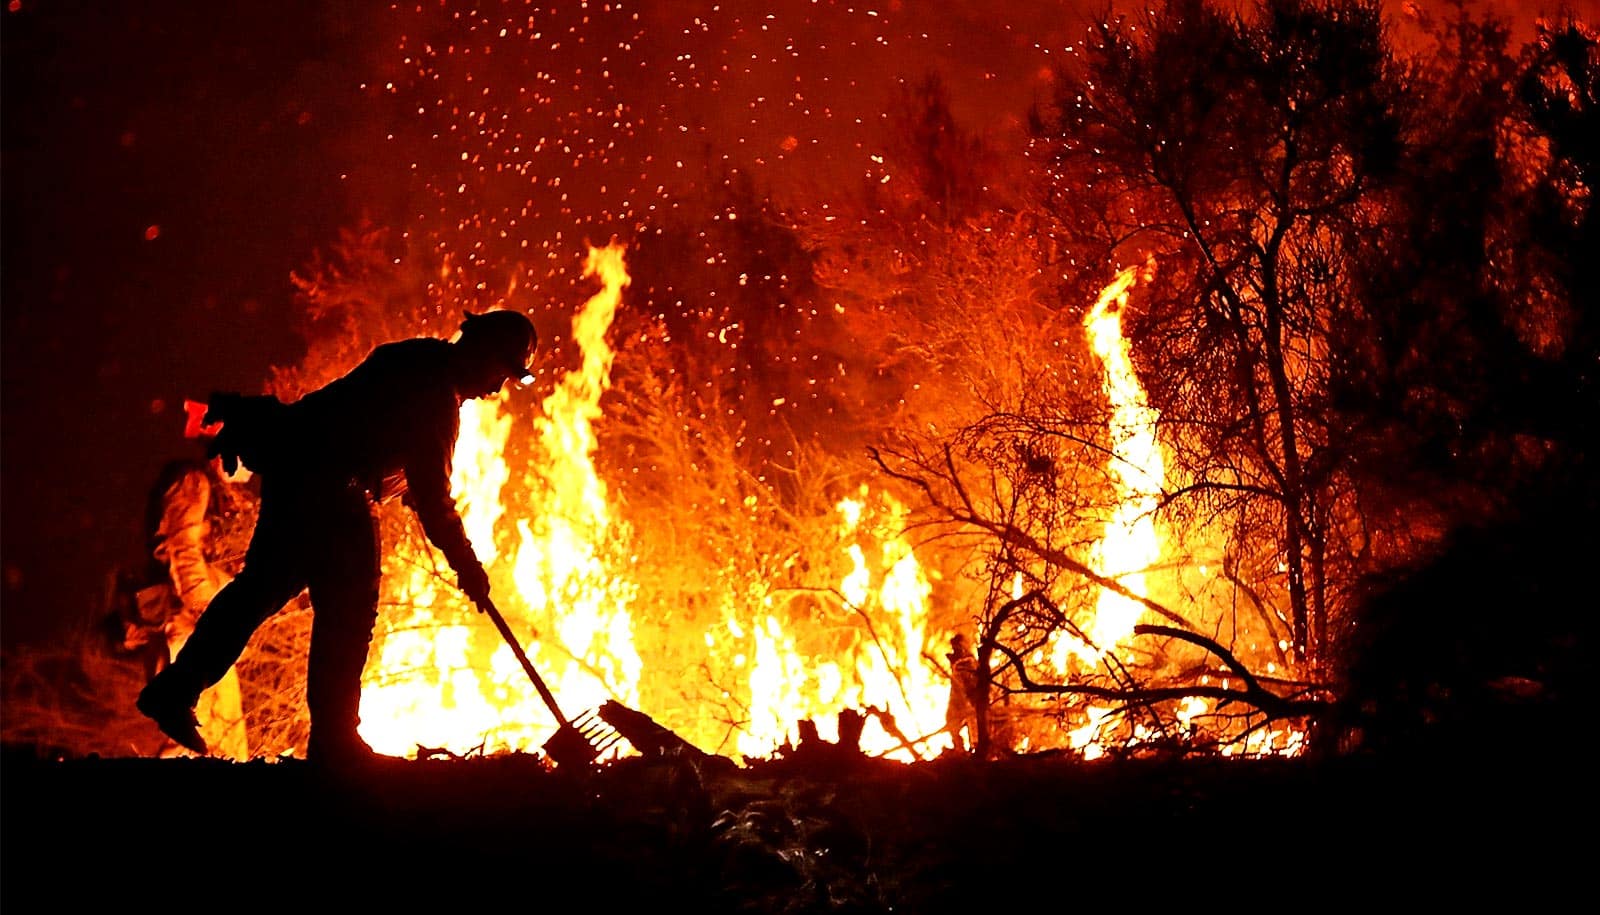
A Cal Fire firefighter monitors a back fire while battling the Medocino Complex fire on August 7, 2018 near Lodoga, California. (Credit: Justin Sullivan/Getty Images )
AI maps forest dryness to better predict wildfires
A new AI model that maps moisture levels in fine detail across 12 western states opens the door for better wildfire predictions.
A deep-learning model that maps forest dryness across 12 western states could pave the way for better wildfire predictions, researchers report.
As California and the American West head into wildfire season amid the coronavirus pandemic, scientists are harnessing artificial intelligence and new satellite data to help predict wildfire blazes across the region.
Anticipating where a fire is likely to ignite and how it might spread requires information about how much burnable plant material exists on the landscape and its dryness. Yet this information is surprisingly difficult to gather at the scale and speed necessary to aid wildfire management .
The new deep-learning model maps fuel moisture levels in fine detail across 12 western states, from Colorado, Montana, Texas, and Wyoming to the Pacific Coast.

The new dataset could “massively improve fire studies,” says Alexandra Konings, an assistant professor of earth system science at Stanford University and senior author of the paper on the work in Remote Sensing of Environment .
The model needs more testing to figure into fire management decisions that put lives and homes on the line, says lead author, Krishna Rao, a PhD student in earth system science. But it’s already illuminating previously invisible patterns. Just being able to see forest dryness unfold pixel by pixel over time, he says, can help reveal areas at greatest risk and “chart out candidate locations for prescribed burns.”
The work comes at a time of growing urgency for this kind of insight, as climate change extends and intensifies the wildfire season—and as the ongoing COVID-19 pandemic complicates efforts to prevent large fires through controlled burns, prepare for mass evacuations, and mobilize first responders.
Wildfire fuel checks
Fire agencies today typically gauge the amount of dried-out, flammable vegetation in an area based on samples from a small number of trees. Researchers chop and weigh tree branches, dry them out in an oven, and then weigh them again.
“You look at how much mass was lost in the oven, and that’s all the water that was in there,” says Konings. “That’s obviously really laborious, and you can only do that in a couple of different places, for only some of the species in a landscape.”
The US Forest Service painstakingly collects this plant water content data at hundreds of sites nationwide and adds them to the National Fuel Moisture Database, which has amassed some 200,000 such measurements since the 1970s. Known as live fuel moisture content, the metric is well established as a factor that influences wildfire risk. Yet little is known about how it varies over time from one plant to another—or from one ecosystem to another.
For decades, scientists have estimated fuel moisture content indirectly, from informed but unproven guesses about relationships between temperature, precipitation, water in dead plants, and the dryness of living ones.
“Now, we are in a position where we can go back and test what we’ve been assuming for so long—the link between weather and live fuel moisture—in different ecosystems of the western United States,” Rao says.
AI with a human assist
The new model uses what researchers call a recurrent neural network, an artificial intelligence system that can learn to recognize patterns in vast mountains of data. The scientists trained their model using field data from the National Fuel Moisture Database, then put it to work estimating fuel moisture from two types of measurements collected by space-borne sensors.
One involves measurements of visible light bouncing off Earth. The other, known as synthetic aperture radar (SAR), measures the return of microwave radar signals, which can penetrate through leafy branches all the way to the ground surface.
“One of our big breakthroughs was to look at a newer set of satellites that are using much longer wavelengths, which allows the observations to be sensitive to water much deeper into the forest canopy and be directly representative of the fuel moisture content,” says Konings, also a center fellow, by courtesy, at Stanford Woods Institute for the Environment.
To train and validate the model, the researchers fed it three years of data for 239 sites across the American west starting in 2015, when SAR data from the European Space Agency’s Sentinel-1 satellites became available.
They checked its fuel moisture predictions in six common types of land cover, including broadleaf deciduous forests, needleleaf evergreen forests, shrublands, grasslands, and sparse vegetation, and found the most accuracy—meaning the AI predictions most closely matched field measurements in the National Fuel Moisture Database—in shrublands .
Rich with aromatic herbs like rosemary and oregano, and often marked by short trees and steep, rocky slopes, shrublands occupy as much as 45% of the American West. They’re not only the region’s biggest ecosystem, Rao says, “they are also extremely susceptible to frequent fires since they grow back rapidly.”
In California, fires whipped to enormous size by Santa Ana winds burn in a type of shrubland known as chaparral. “This has led fire agencies to monitor them intensively,” he says.
The model’s estimates feed into an interactive map that fire agencies may eventually be able to use to identify patterns and prioritize control measures. For now, the map offers a dive through history, showing fuel moisture content from 2016 to 2019, but researchers could use the same method to display current estimates.
“Creating these maps was the first step in understanding how this new fuel moisture data might affect fire risk and predictions,” Konings says. “Now we’re trying to really pin down the best ways to use it for improved fire prediction.”
Additional coauthors are from Lamont-Doherty Earth Observatory at Columbia University. Amazon Web Services (AWS) Cloud Credits for Research, the NASA Earth and Space Science Fellowship, the UPS Endowment Fund at Stanford, the Stanford Woods Institute for the Environment, and the Zegar Family Foundation supported the work.
Source: Stanford University
The post AI maps forest dryness to better predict wildfires appeared first on Futurity .
Share this article:
This article uses material from the Futurity article, and is licenced under a CC BY-SA 4.0 International License. Images, videos and audio are available under their respective licenses.
Related Articles:
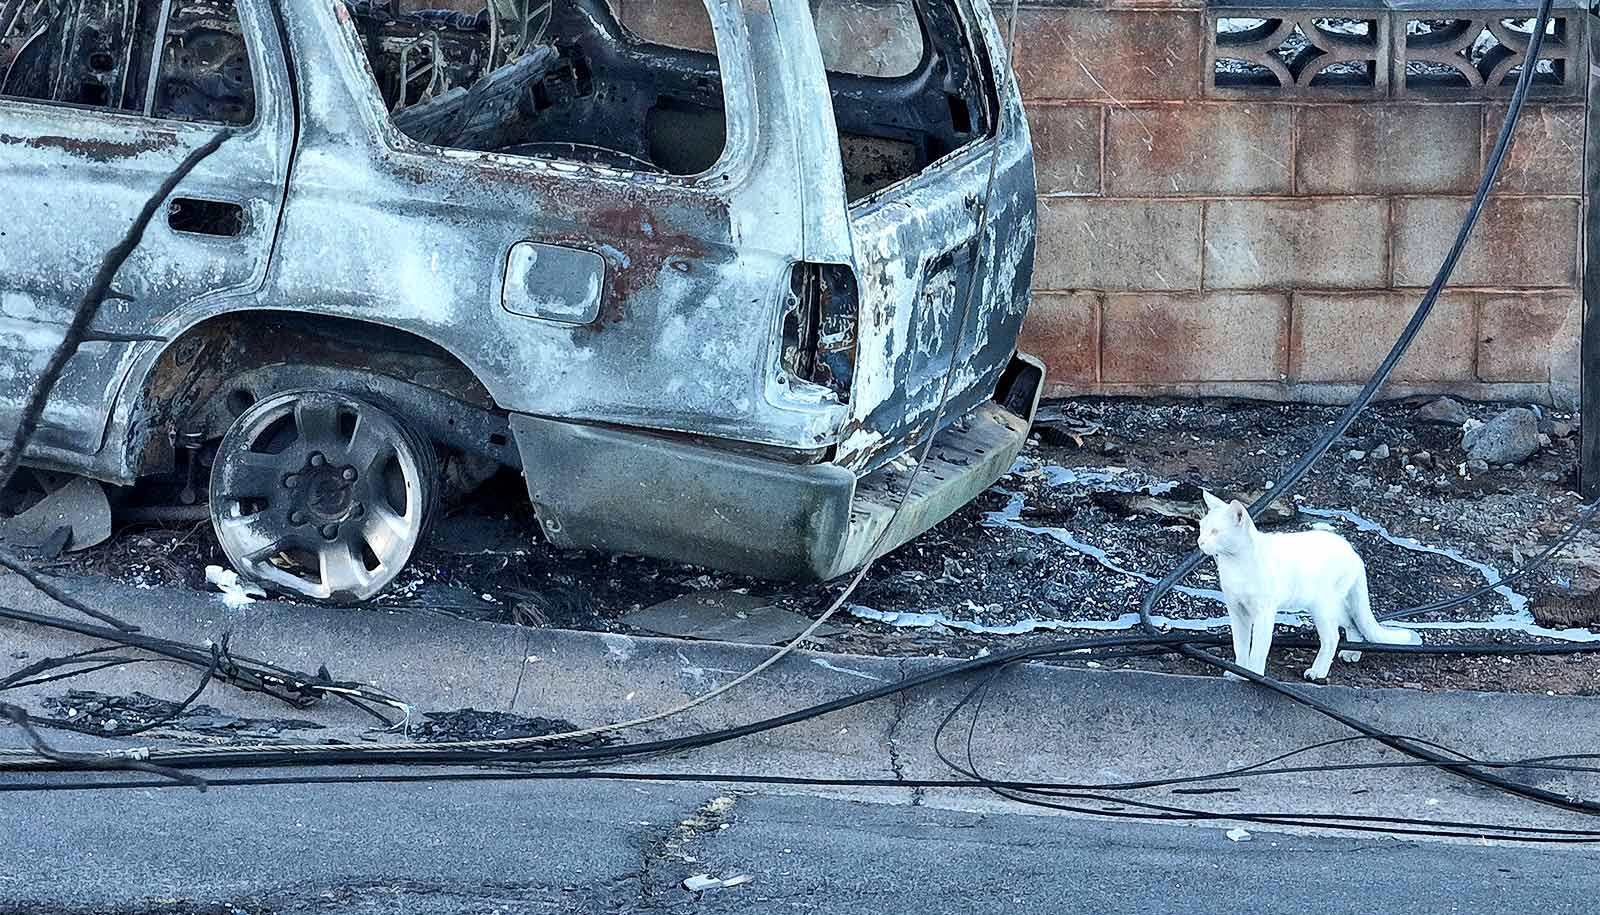
AI-powered maps could guide Maui fire recovery
Aug. 30, 2023 • futurity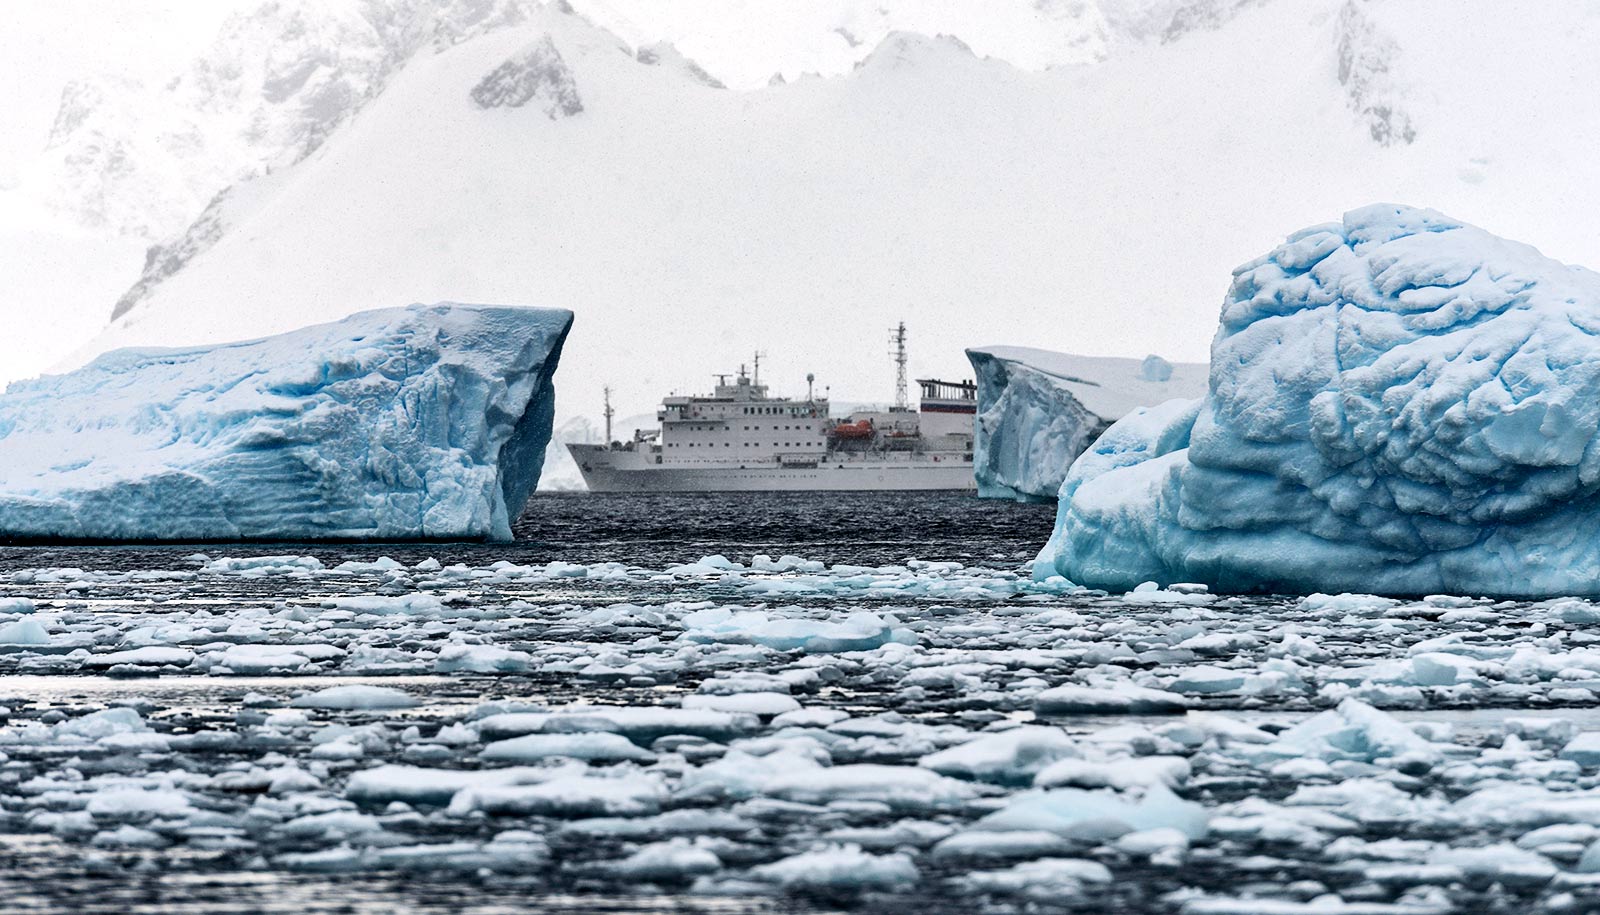
Antarctica ice flow map is super accurate
July 30, 2019 • futurityLinks/images:
- https://www.futurity.org/wildfires-gel-fire-retardant-2173622/
- https://doi.org/10.1016/j.rse.2020.111797
- https://www.futurity.org/wildfires-climate-change-california-2179612/
- https://www.futurity.org/trees-carbon-dioxide-timeline-2137432/
- https://kkraoj.users.earthengine.app/view/live-fuel-moisture
- https://www.futurity.org/wildfire-el-nino-climate-change-1862802/
- https://news.stanford.edu/2020/05/21/mapping-dry-wildfire-fuels-ai-new-satellite-data/
- https://www.futurity.org/ai-wildfires-prediction-2373572-2/
- https://www.futurity.org