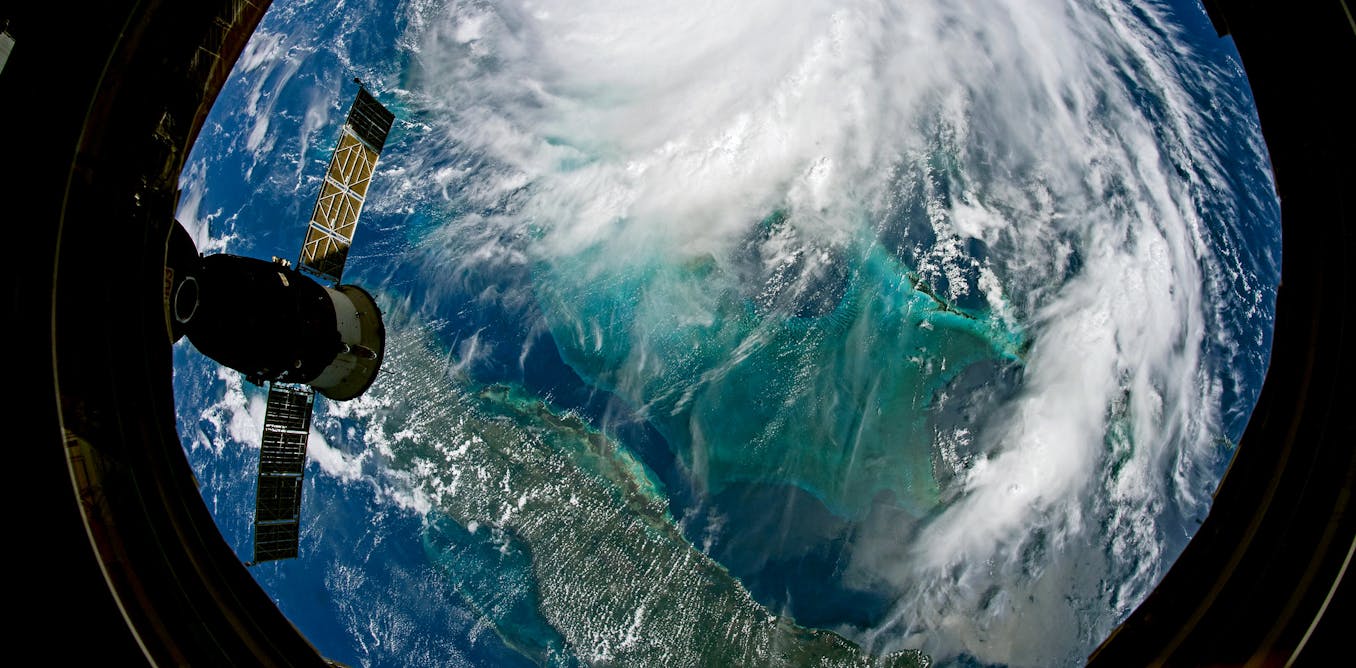
The science everyone needs to know about climate change, in 6 charts

Take a closer look at what’s driving climate change and how scientists know CO2 is involved, in a series of charts examining the evidence in different ways.

Betsy Weatherhead, Senior Scientist, University of Colorado Boulder • conversation
Nov. 1, 2021 ~9 min

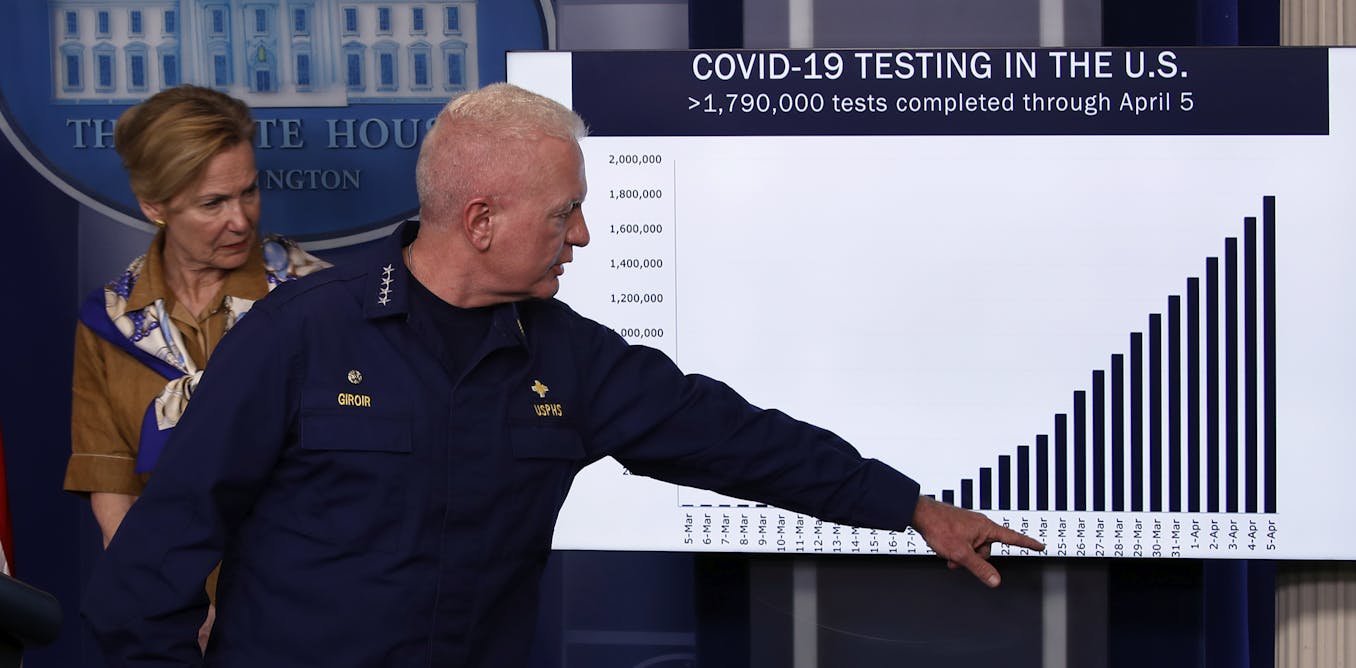
3 questions to ask yourself next time you see a graph, chart or map

Visualizations can help you understand data better – but they can also confuse or mislead. Here, some tips on what to watch out for.

Carson MacPherson-Krutsky, PhD Candidate in Geosciences, Boise State University • conversation
July 24, 2020 ~8 min


The secondhand smoke you're breathing may have come from another state

According to a new study, about four in 10 air pollution deaths in the US are due to emissions crossing state lines.

Steven Barrett, Professor of Aeronautics and Astronautics, Massachusetts Institute of Technology • conversation
Feb. 12, 2020 ~7 min

/

1