14-W_2000_track.png

Size of this preview:
800 × 495 pixels
.
Other resolutions:
320 × 198 pixels
|
640 × 396 pixels
|
1,024 × 633 pixels
|
1,280 × 791 pixels
|
2,700 × 1,669 pixels
.
Summary
| Description |
English:
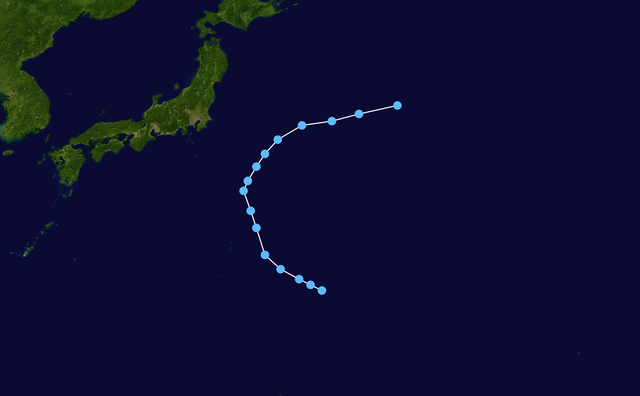
Track map of
Tropical Depression 14W
of the
2000 Pacific typhoon season
. The points show the location of the storm at 6-hour intervals. The colour represents the storm's
maximum sustained wind speeds
as classified in the (see below), and the shape of the data points represent the nature of the storm, according to the legend below.
Tropical depression (≤38 mph, ≤62 km/h)
Tropical storm (39–73 mph, 63–118 km/h)
Category 1 (74–95 mph, 119–153 km/h)
Category 2 (96–110 mph, 154–177 km/h)
Category 3 (111–129 mph, 178–208 km/h)
Category 4 (130–156 mph, 209–251 km/h)
Category 5 (≥157 mph, ≥252 km/h)
Unknown
Storm type |
| Date | 2000-08-06–2000-08-10 |
| Source | Created by Nilfanion using Wikipedia:WikiProject Tropical cyclones/Tracks . The background image is from NASA . Tracking data is from the Joint Typhoon Warning Center [1] . |
| Author | Nilfanion |
Licensing
|
|
This work has been released into the
public domain
by its author,
Nilfanion
. This applies worldwide.
In some countries this may not be legally possible; if so: Nilfanion grants anyone the right to use this work for any purpose , without any conditions, unless such conditions are required by law. |