1873_Atlantic_hurricane_season_summary_map.png

Size of this preview:
800 × 525 pixels
.
Other resolutions:
320 × 210 pixels
|
640 × 420 pixels
|
1,024 × 671 pixels
|
1,280 × 839 pixels
|
3,000 × 1,967 pixels
.
| Description |
English:
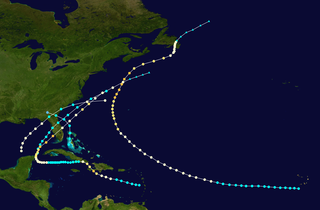
This map shows the tracks of all
tropical cyclones
in the
1873 Atlantic hurricane season
. The points show the location of each storm at 6-hour intervals. The colour represents the storm's
maximum sustained wind speeds
as classified in the Saffir-Simpson Hurricane Scale (see below), and the shape of the data points represent the type of the storm.
Tropical depression (≤38 mph, ≤62 km/h)
Tropical storm (39–73 mph, 63–118 km/h)
Category 1 (74–95 mph, 119–153 km/h)
Category 2 (96–110 mph, 154–177 km/h)
Category 3 (111–129 mph, 178–208 km/h)
Category 4 (130–156 mph, 209–251 km/h)
Category 5 (≥157 mph, ≥252 km/h)
Unknown
Storm type |
| Source | Created using Wikipedia:WikiProject Tropical cyclones/Tracks . The background image is from NASA [1] . The tracking data is from the National Hurricane Center 's Atlantic hurricane database |
| Author | Supportstorm |

|
This file may be updated to reflect new information.
If you wish to use a specific version of the file without new updates being mirrored, please upload the required version as a separate file. |
|
|
This work has been released into the
public domain
by its author,
Supportstorm
. This applies worldwide.
In some countries this may not be legally possible; if so: Supportstorm grants anyone the right to use this work for any purpose , without any conditions, unless such conditions are required by law. |