2006Chinese_exports.PNG
Size of this preview:
800 × 351 pixels
.
Other resolutions:
320 × 140 pixels
|
640 × 281 pixels
|
1,425 × 625 pixels
.
Summary
| Description |
English:
This
bubble map
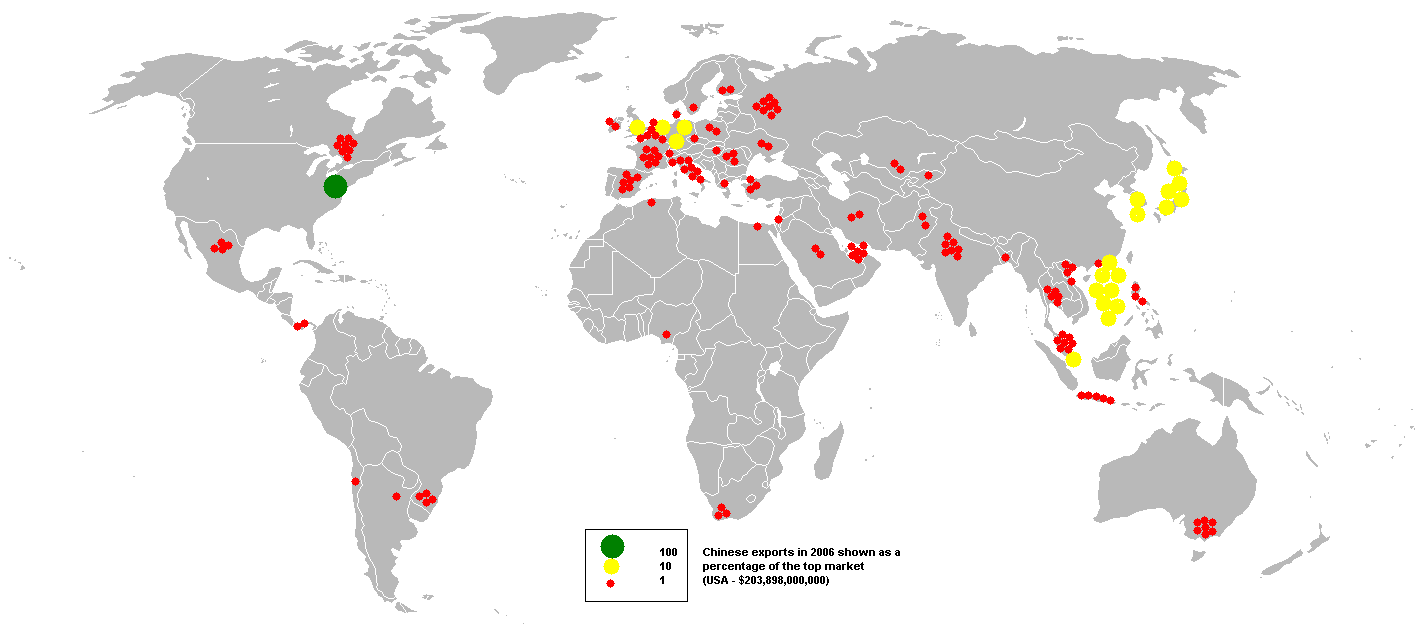
shows the global distribution of Chinese exports in 2006 as a percentage of the top market (USA - $203,898,000,000).
This map is consistent with incomplete set of data too as long as the top producer is known. It resolves the accessibility issues faced by colour-coded maps that may not be properly rendered in old computer screens. Data was extracted on 30th September 2007 from http://www.imfstatistics.org/DOT Based on :Image:BlankMap-World.png |
||
| Date | 30 September 2007 (original upload date) | ||
| Source | Transferred from en.wikipedia to Commons by Ramisses . | ||
| Author | Anwar saadat at English Wikipedia | ||
| Other versions |
|

Licensing
|
|
This work has been released into the
public domain
by its author,
Anwar saadat
at
English Wikipedia
. This applies worldwide.
In some countries this may not be legally possible; if so: Anwar saadat grants anyone the right to use this work for any purpose , without any conditions, unless such conditions are required by law. |
Original upload log
The original description page was
here
. All following user names refer to en.wikipedia.
- 2007-09-30 09:48 Anwar saadat 1425×625× (62250 bytes) This bubble map shows the global distribution of Chinese exports in 2006 as a percentage of the top market (USA - $203,898,000,000). This map is consistent with incomplete set of data too as long as the top producer is known. It resolves the accessibilit