2017_United_States_Senate_special_election_in_Alabama_results_map_by_county.svg

Size of this PNG preview of this SVG file:
600 × 600 pixels
.
Other resolutions:
240 × 240 pixels
|
480 × 480 pixels
|
768 × 768 pixels
|
1,024 × 1,024 pixels
|
2,048 × 2,048 pixels
|
810 × 810 pixels
.
Summary
| Description |
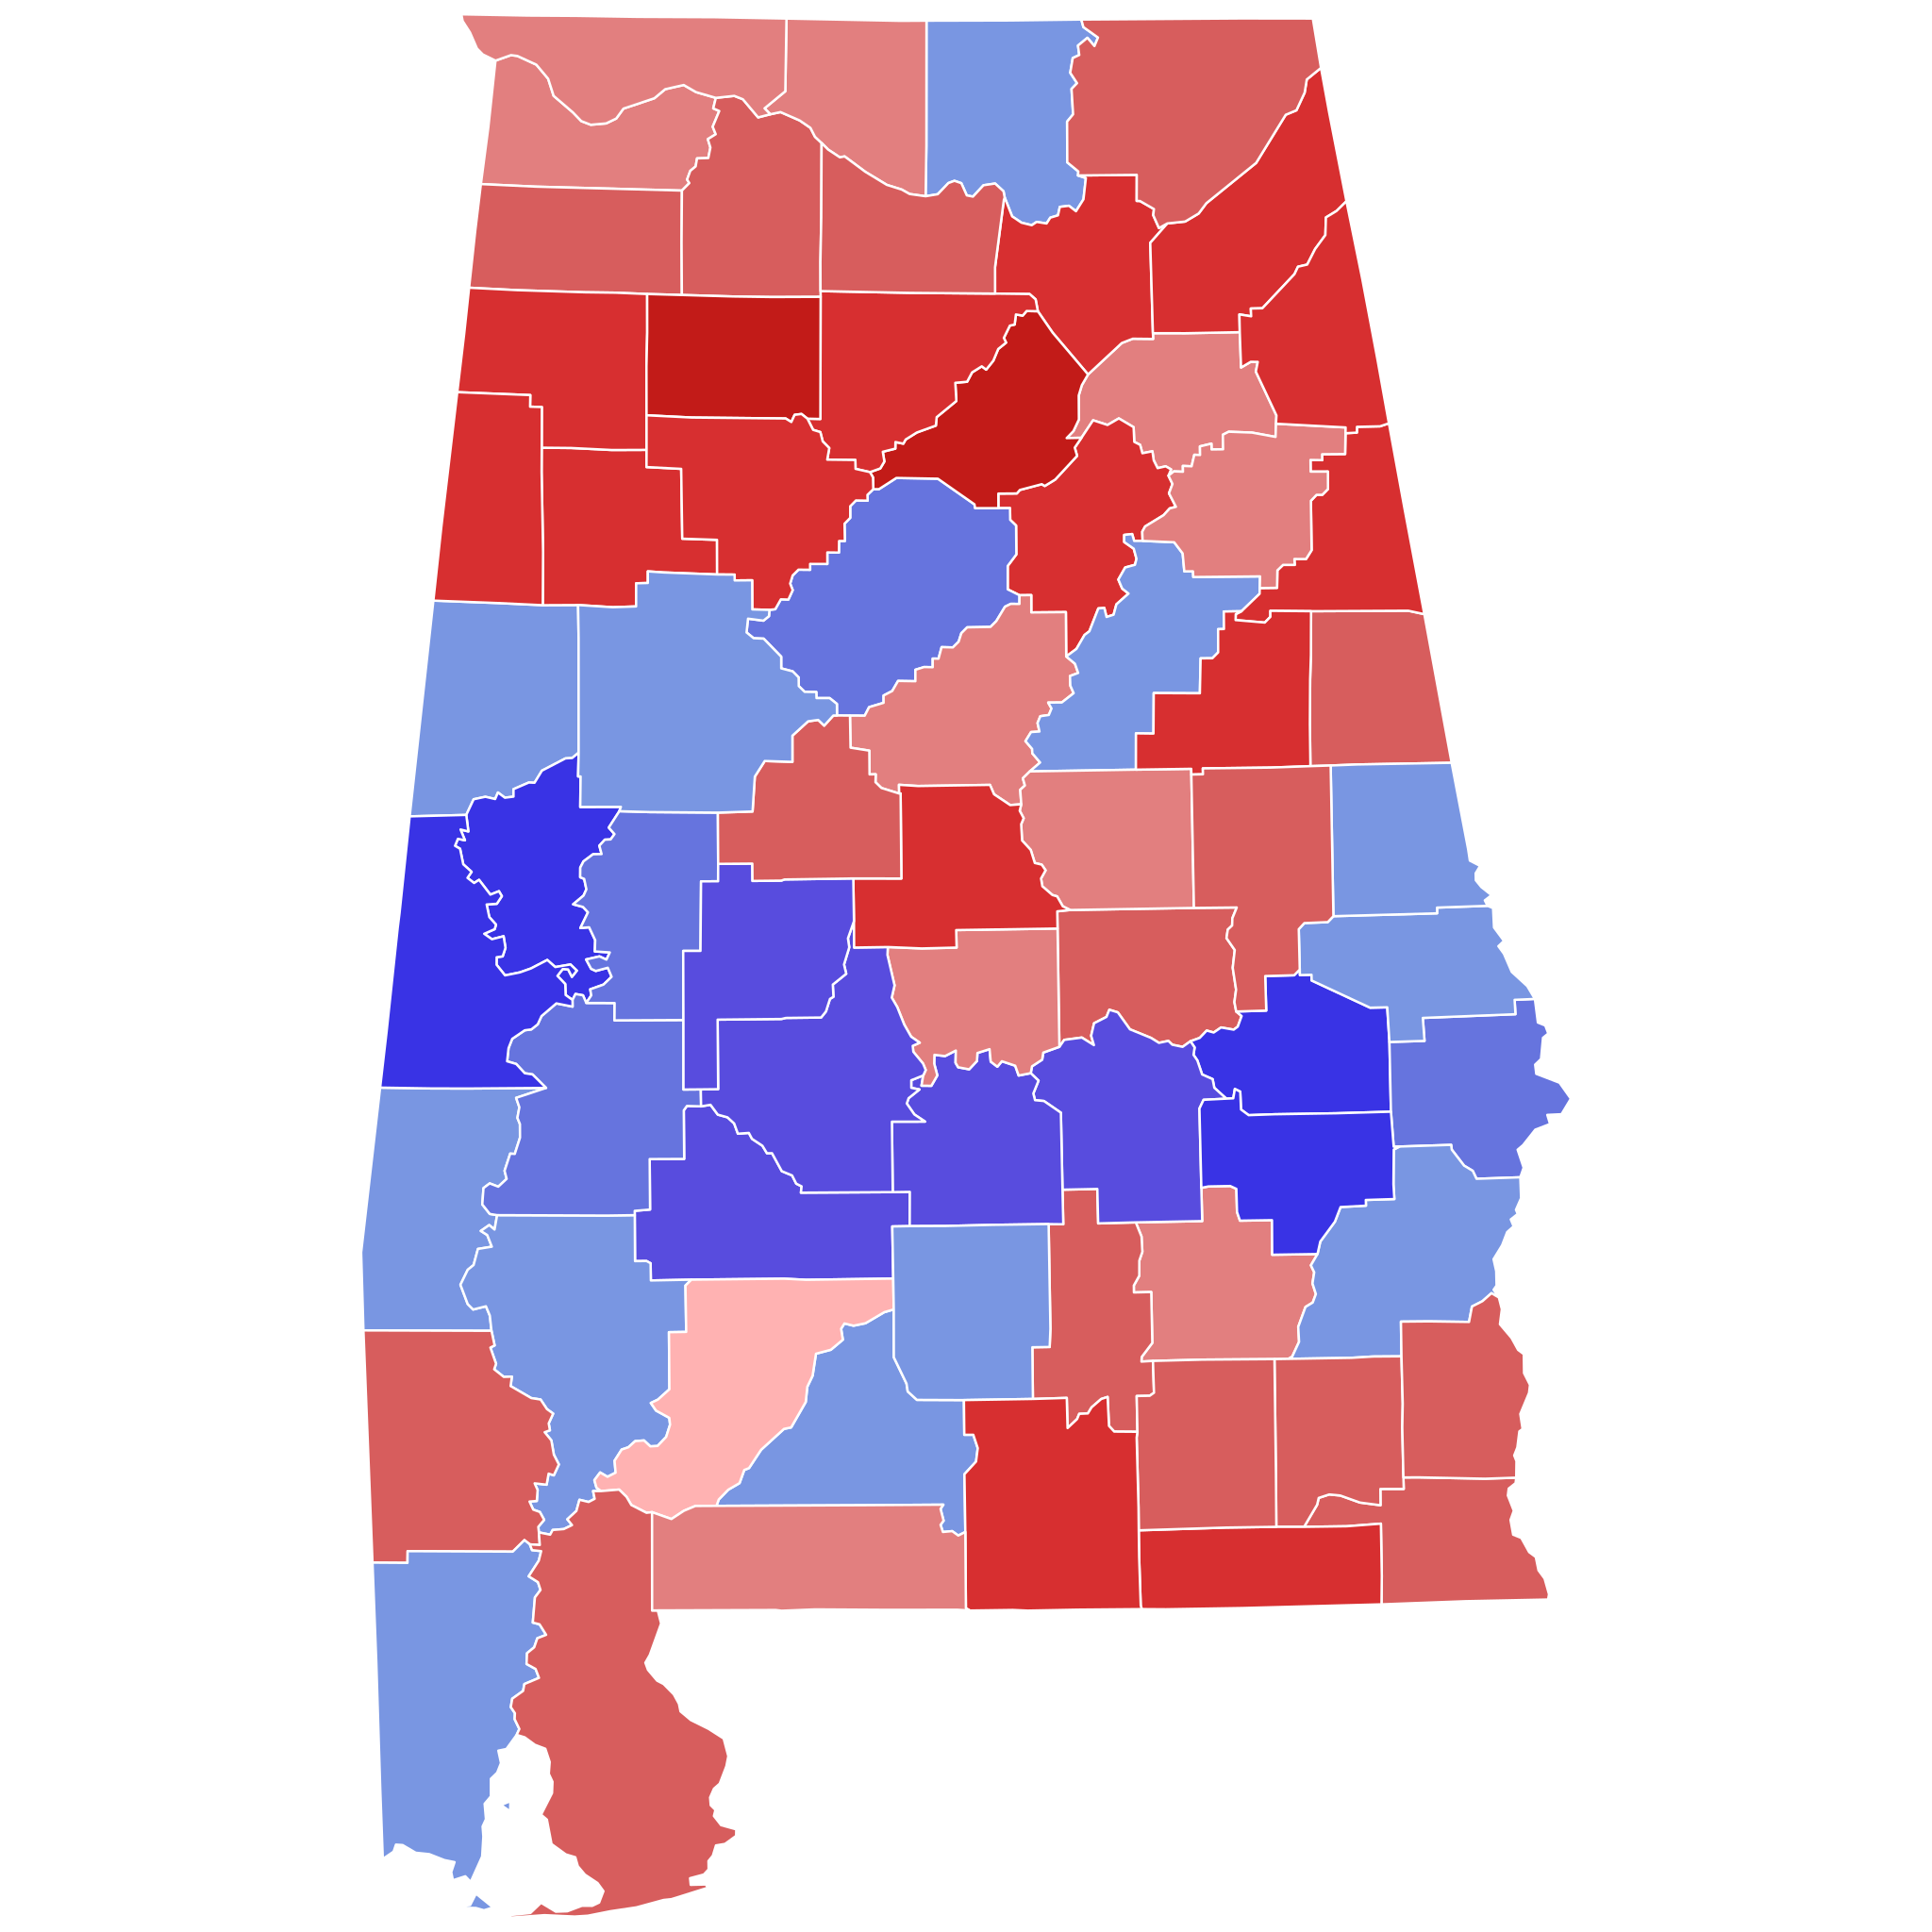
Percentage of the vote each candidate took in the 2017 U.S. Senate special election in Alabama by county. Data used to create map is from Politico .
Moore
40%
50%
60%
70%
80%
Jones
40%
50%
60%
70%
80%
|
|
| Date | ||
| Source | Own work | |
| Author | WClarke |
Licensing
I, the copyright holder of this work, hereby publish it under the following license:
This file is licensed under the
Creative Commons
Attribution-Share Alike 4.0 International
license.
-
You are free:
- to share – to copy, distribute and transmit the work
- to remix – to adapt the work
-
Under the following conditions:
- attribution – You must give appropriate credit, provide a link to the license, and indicate if changes were made. You may do so in any reasonable manner, but not in any way that suggests the licensor endorses you or your use.
- share alike – If you remix, transform, or build upon the material, you must distribute your contributions under the same or compatible license as the original.