Uploader generated most of SVG code with the
Horizontal bar charts
spreadsheet from
User:RCraig09/Excel to XML for SVG
; color changes, and minor moves and nudges, were performed manually in a text editor on the SVG code.
The following files relate to cumulative greenhouse gas emissions, some by country, some grouped by region:
20211228 Cumulative greenhouse gas emissions by country and region - bar chart TR.svg (Turkish)
20211026 Cumulative carbon dioxide CO2 emissions by country - bar chart.svg
20211228 Cumulative greenhouse gas emissions by country and region - bar chart.svg
1850-2019 Cumulative greenhouse gas emissions by region - bar chart - IPCC AR6 WG3 - Fig SPM.2b.svg
Raw data
Uploader determined data values by physically measuring extent of bars in source's bar chart, and used Microsft Excel to convert to the following values that are represented in the above graphic.
Aside: so many significant digits are generated as an unintended result of Microsoft Excel's calculations; actual precision is much less than the following numbers indicate!
Click at right to show/hide raw data
VERSION 1 (28 Dec 2021):
A B C D Total
USA 164.6437995 180.474934 136.1477573 123.4828496 604.7493404
China 63.32453826 101.3192612 129.8153034 281.7941953 576.2532982
EU27 145.646438 189.9736148 107.651715 104.4854881 547.7572559
Russia 34.82849604 91.82058047 53.82585752 39.57783641 220.0527704
Rest of SE Asia 39.57783641 53.82585752 50.65963061 69.65699208 213.7203166
Rest of Africa 41.16094987 56.99208443 47.49340369 66.49076517 212.1372032
India 31.66226913 34.82849604 37.99472296 79.15567282 183.6411609
Indonesia 25.3298153 44.32717678 53.82585752 44.32717678 167.8100264
Rest, Latin Amer 28.49604222 50.65963061 37.99472296 47.49340369 164.6437995
Brazil 18.99736148 47.49340369 34.82849604 41.16094987 142.4802111
Middle East 6.332453826 25.3298153 34.82849604 47.49340369 113.9841689
Japan 11.0817942 34.82849604 28.49604222 25.3298153 99.73614776
Canada 14.24802111 18.99736148 15.83113456 18.99736148 68.07387863
AUS/NZeal 11.0817942 18.99736148 15.83113456 15.83113456 61.7414248
Ukraine 6.332453826 22.16358839 11.0817942 11.0817942 50.65963061
Mexico 6.332453826 12.66490765 12.66490765 15.83113456 47.49340369
Other EU 6.332453826 12.66490765 9.498680739 9.498680739 37.99472296
South Korea 1.583113456 4.749340369 11.0817942 17.41424802 34.82849604
South Africa 3.166226913 9.498680739 9.498680739 12.66490765 34.82849604
Turkey 4.749340369 4.749340369 6.332453826 12.66490765 28.49604222
Rest of Asia 0 7.915567282 6.332453826 12.66490765 26.91292876
Nigeria 3.166226913 6.332453826 6.332453826 9.498680739 25.3298153
Saudi Arabia 0 3.166226913 6.332453826 12.66490765 22.16358839
VERSION 2 (29 Dec 2021): (re-ordered based on historical empirically based data = sum of first three numerical columns)
1850-1949 1950-1989 1990-2010 2011-2030 Sum of 3 columns only
USA 164.6437995 180.474934 136.1477573 123.4828496 481.3
EU27 145.646438 189.9736148 107.651715 104.4854881 443.3
China 63.32453826 101.3192612 129.8153034 281.7941953 294.5
Russia 34.82849604 91.82058047 53.82585752 39.57783641 180.5
Rest of Africa 41.16094987 56.99208443 47.49340369 66.49076517 145.6
Rest of SE Asia 39.57783641 53.82585752 50.65963061 69.65699208 144.1
Indonesia 25.3298153 44.32717678 53.82585752 44.32717678 123.5
Rest, Latin Amer 28.49604222 50.65963061 37.99472296 47.49340369 117.2
India 31.66226913 34.82849604 37.99472296 79.15567282 104.5
Brazil 18.99736148 47.49340369 34.82849604 41.16094987 101.3
Japan 11.0817942 34.82849604 28.49604222 25.3298153 74.4
Middle East 6.332453826 25.3298153 34.82849604 47.49340369 66.5
Canada 14.24802111 18.99736148 15.83113456 18.99736148 49.1
AUS/NZeal 11.0817942 18.99736148 15.83113456 15.83113456 45.9
Ukraine 6.332453826 22.16358839 11.0817942 11.0817942 39.6
Mexico 6.332453826 12.66490765 12.66490765 15.83113456 31.7
Other EU 6.332453826 12.66490765 9.498680739 9.498680739 28.5
South Africa 3.166226913 9.498680739 9.498680739 12.66490765 22.2
South Korea 1.583113456 4.749340369 11.0817942 17.41424802 17.4
Turkey 4.749340369 4.749340369 6.332453826 12.66490765 15.8
Nigeria 3.166226913 6.332453826 6.332453826 9.498680739 15.8
Rest of Asia 0 7.915567282 6.332453826 12.66490765 14.2
Saudi Arabia 0 3.166226913 6.332453826 12.66490765 9.5
Licensing
I, the copyright holder of this work, hereby publish it under the following license:
to share
– to copy, distribute and transmit the work
to remix
– to adapt the work
Under the following conditions:
attribution
– You must give appropriate credit, provide a link to the license, and indicate if changes were made. You may do so in any reasonable manner, but not in any way that suggests the licensor endorses you or your use.
share alike
– If you remix, transform, or build upon the material, you must distribute your contributions under the
same or compatible license
as the original.

 20211228 Cumulative greenhouse gas emissions by country and region - bar chart TR.svg (Turkish)
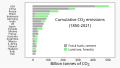 20211026 Cumulative carbon dioxide CO2 emissions by country - bar chart.svg
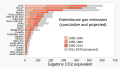 20211228 Cumulative greenhouse gas emissions by country and region - bar chart.svg
 1850-2019 Cumulative greenhouse gas emissions by region - bar chart - IPCC AR6 WG3 - Fig SPM.2b.svg


