Africa_temperature.png
Summary
| Description |
English:
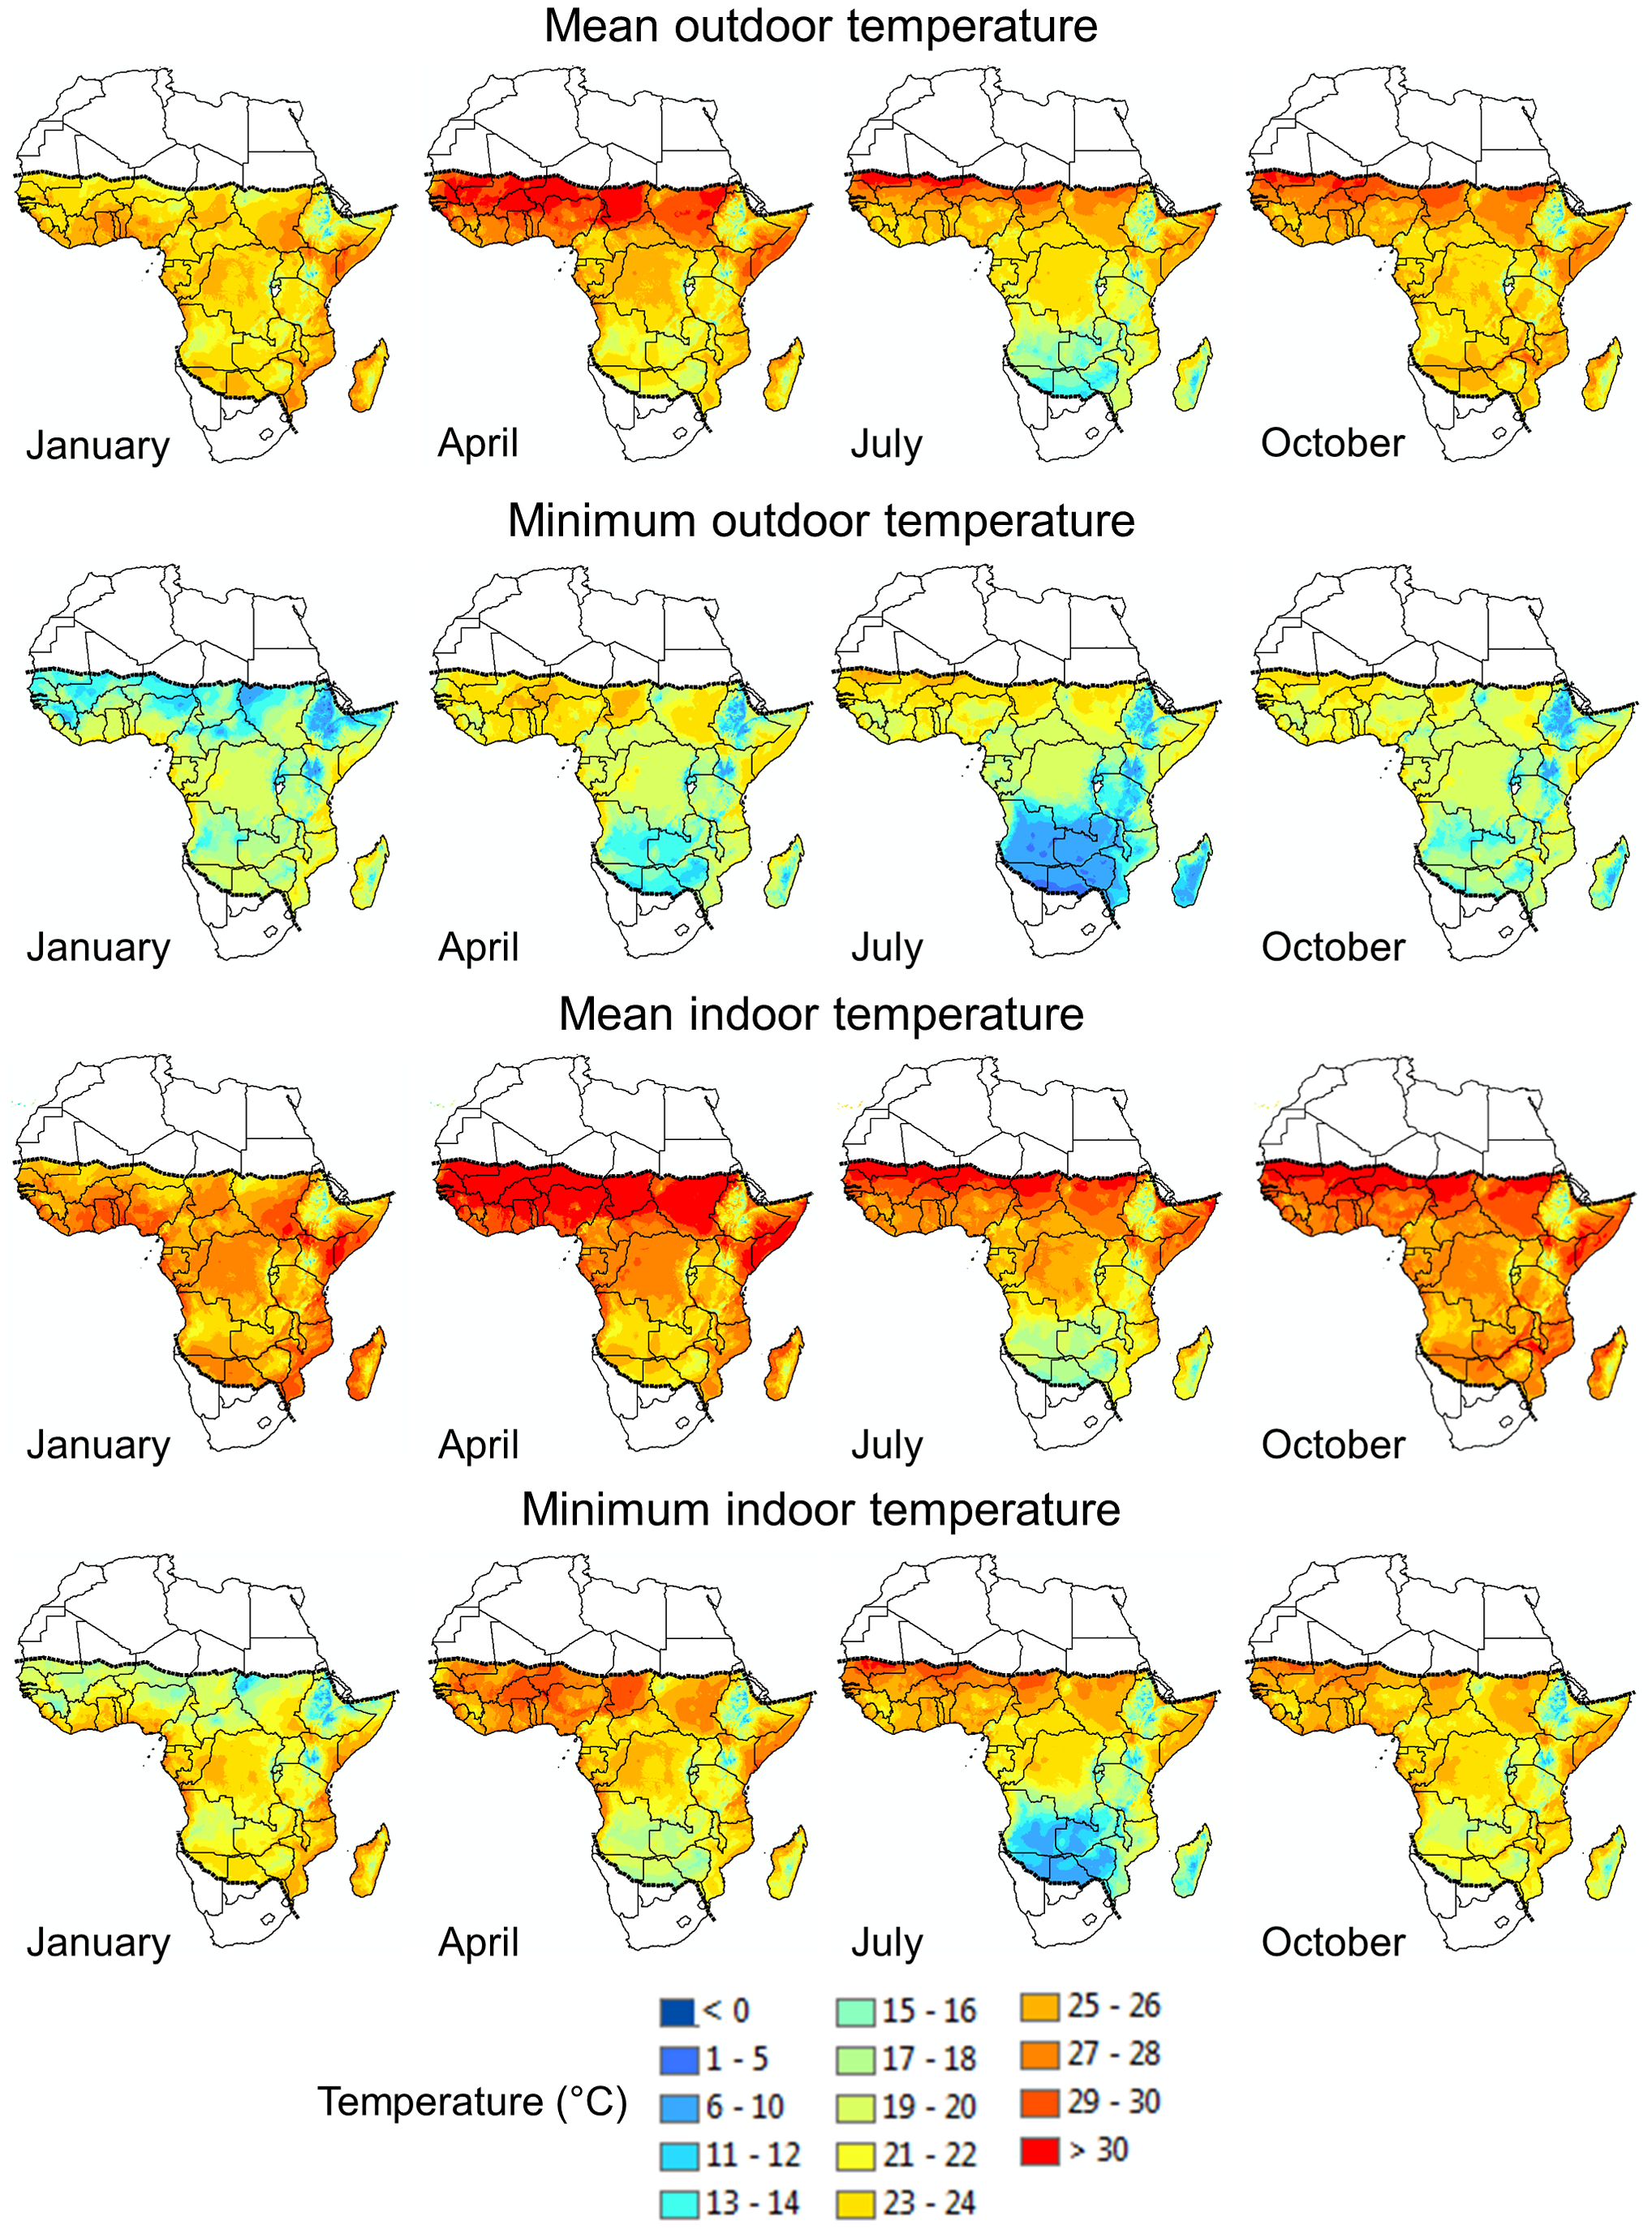
Monthly mean and minimum outdoor and indoor temperatures throughout Africa for January, April, July, and October.
Outdoor monthly mean (top row) and minimum (second row) temperatures. Temperature surfaces were generated by interpolation using weather station data collected between 1960 and 1990. For areas where data records were limited, such as in the Democratic Republic of the Congo, the time period was extended to 2000 (see [45] for details). The current geographical limits of malaria transmission are demarcated by the dotted lines. Indoor monthly mean (third row) and minimum (bottom row) temperatures. Indoor temperature estimates were determined using regression equations that capture the relationship between indoor and outdoor temperatures at different elevations. These regressions were used to convert the outdoor temperature surfaces to matching estimates of indoor temperatures (see [46] for more detailed information). doi:10.1371/journal.ppat.1003602.g001 |
| Date | |
| Source | Glunt KD, Blanford JI, Paaijmans KP (2013) Chemicals, Climate, and Control: Increasing the Effectiveness of Malaria Vector Control Tools by Considering Relevant Temperatures. PLoS Pathog 9(10): e1003602. doi:10.1371/journal.ppat.1003602 |
| Author | Katey D. Glunt, Justine I. Blanford, Krijn P. Paaijmans |
| Other versions |

|
Licensing
-
You are free:
- to share – to copy, distribute and transmit the work
- to remix – to adapt the work
-
Under the following conditions:
- attribution – You must give appropriate credit, provide a link to the license, and indicate if changes were made. You may do so in any reasonable manner, but not in any way that suggests the licensor endorses you or your use.