Age_Specific_SEER_Incidence_Rates_2003-2007.svg

Size of this PNG preview of this SVG file:
582 × 519 pixels
.
Other resolutions:
269 × 240 pixels
|
538 × 480 pixels
|
861 × 768 pixels
|
1,148 × 1,024 pixels
|
2,297 × 2,048 pixels
.
Summary
| Description |
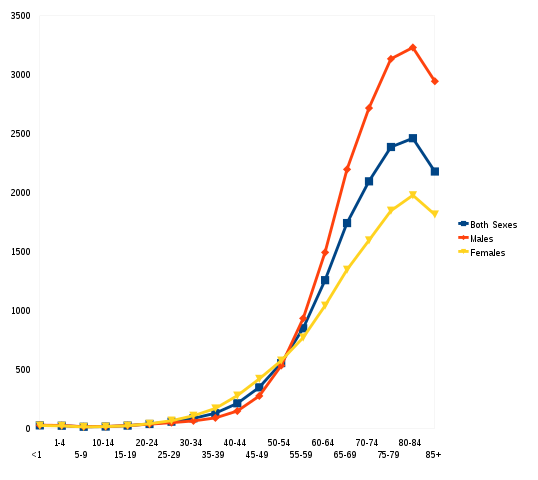
SEER Cancer Statistics, Age-Specific SEER Incidence Rates, 2003-2007 From table 2.7 [1] Graph was created in open office from CSV data. Footnote for rates reads as: rates are per 100,000 / adjusted. Released April 15, 2010 |
| Date | |
| Source | Own work Data: http://seer.cancer.gov/csr/1975_2007/ |
| Author | Nevit Dilmen ( talk ) |
Licensing
|
|
I, the copyright holder of this work, release this work into the
public domain
. This applies worldwide.
In some countries this may not be legally possible; if so: I grant anyone the right to use this work for any purpose , without any conditions, unless such conditions are required by law. |