Australia_General_Election_2022_--_Two-Party-Preferred_Votes.svg

Size of this PNG preview of this SVG file:
773 × 600 pixels
.
Other resolutions:
309 × 240 pixels
|
619 × 480 pixels
|
990 × 768 pixels
|
1,280 × 993 pixels
|
2,560 × 1,987 pixels
|
1,608 × 1,248 pixels
.
Summary
| Description |
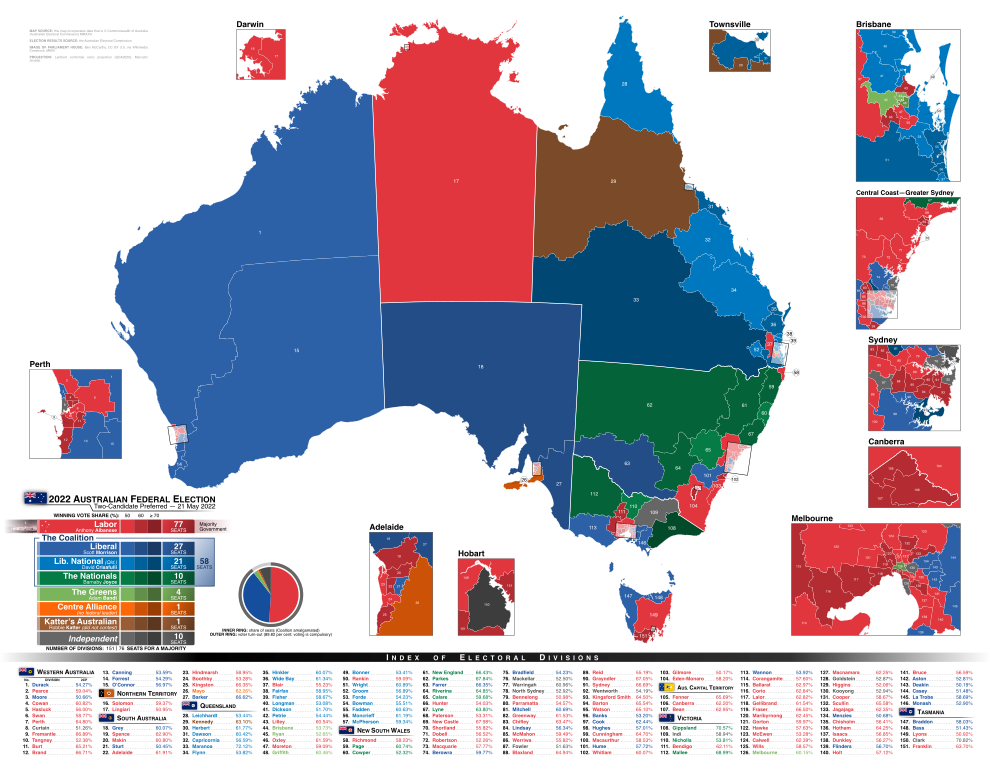
English:
A map showing all 151 federal electoral divisions. Each division is shown in the colour of the party that won during the 2022 Australian Federal Election in said division, after preferences. The shade of the colour indicates the vote strength of the winning party — the darker the colour, the higher the share of votes and vice versa.
|
| Date | |
| Source | Own work |
| Author | Eric0892 |
Licensing
I, the copyright holder of this work, hereby publish it under the following license:
This file is licensed under the
Creative Commons
Attribution-Share Alike 4.0 International
license.
-
You are free:
- to share – to copy, distribute and transmit the work
- to remix – to adapt the work
-
Under the following conditions:
- attribution – You must give appropriate credit, provide a link to the license, and indicate if changes were made. You may do so in any reasonable manner, but not in any way that suggests the licensor endorses you or your use.
- share alike – If you remix, transform, or build upon the material, you must distribute your contributions under the same or compatible license as the original.