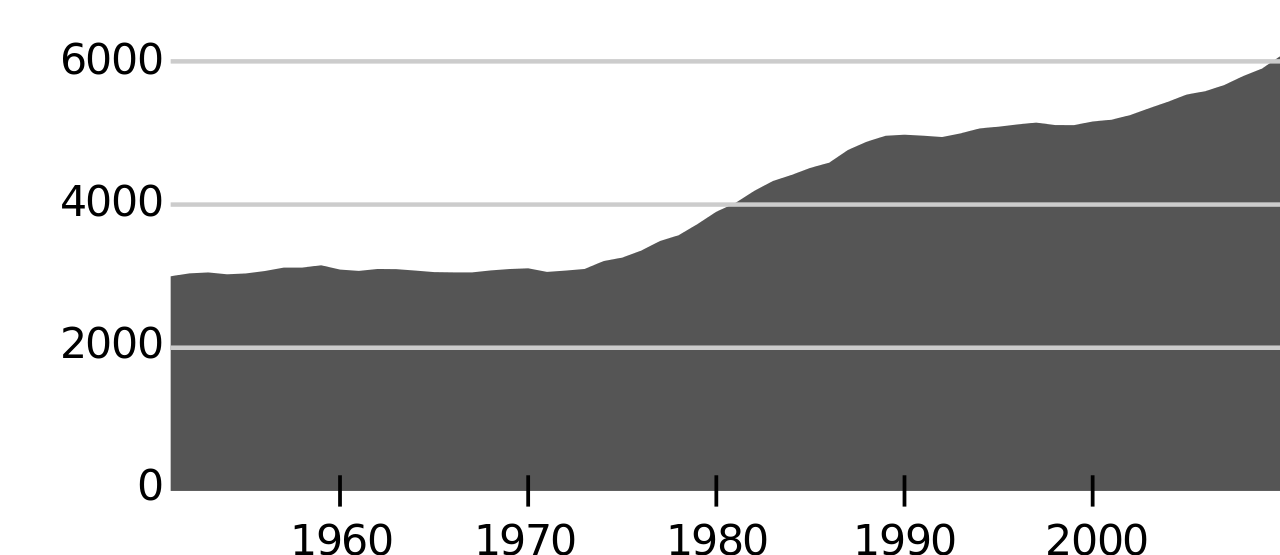
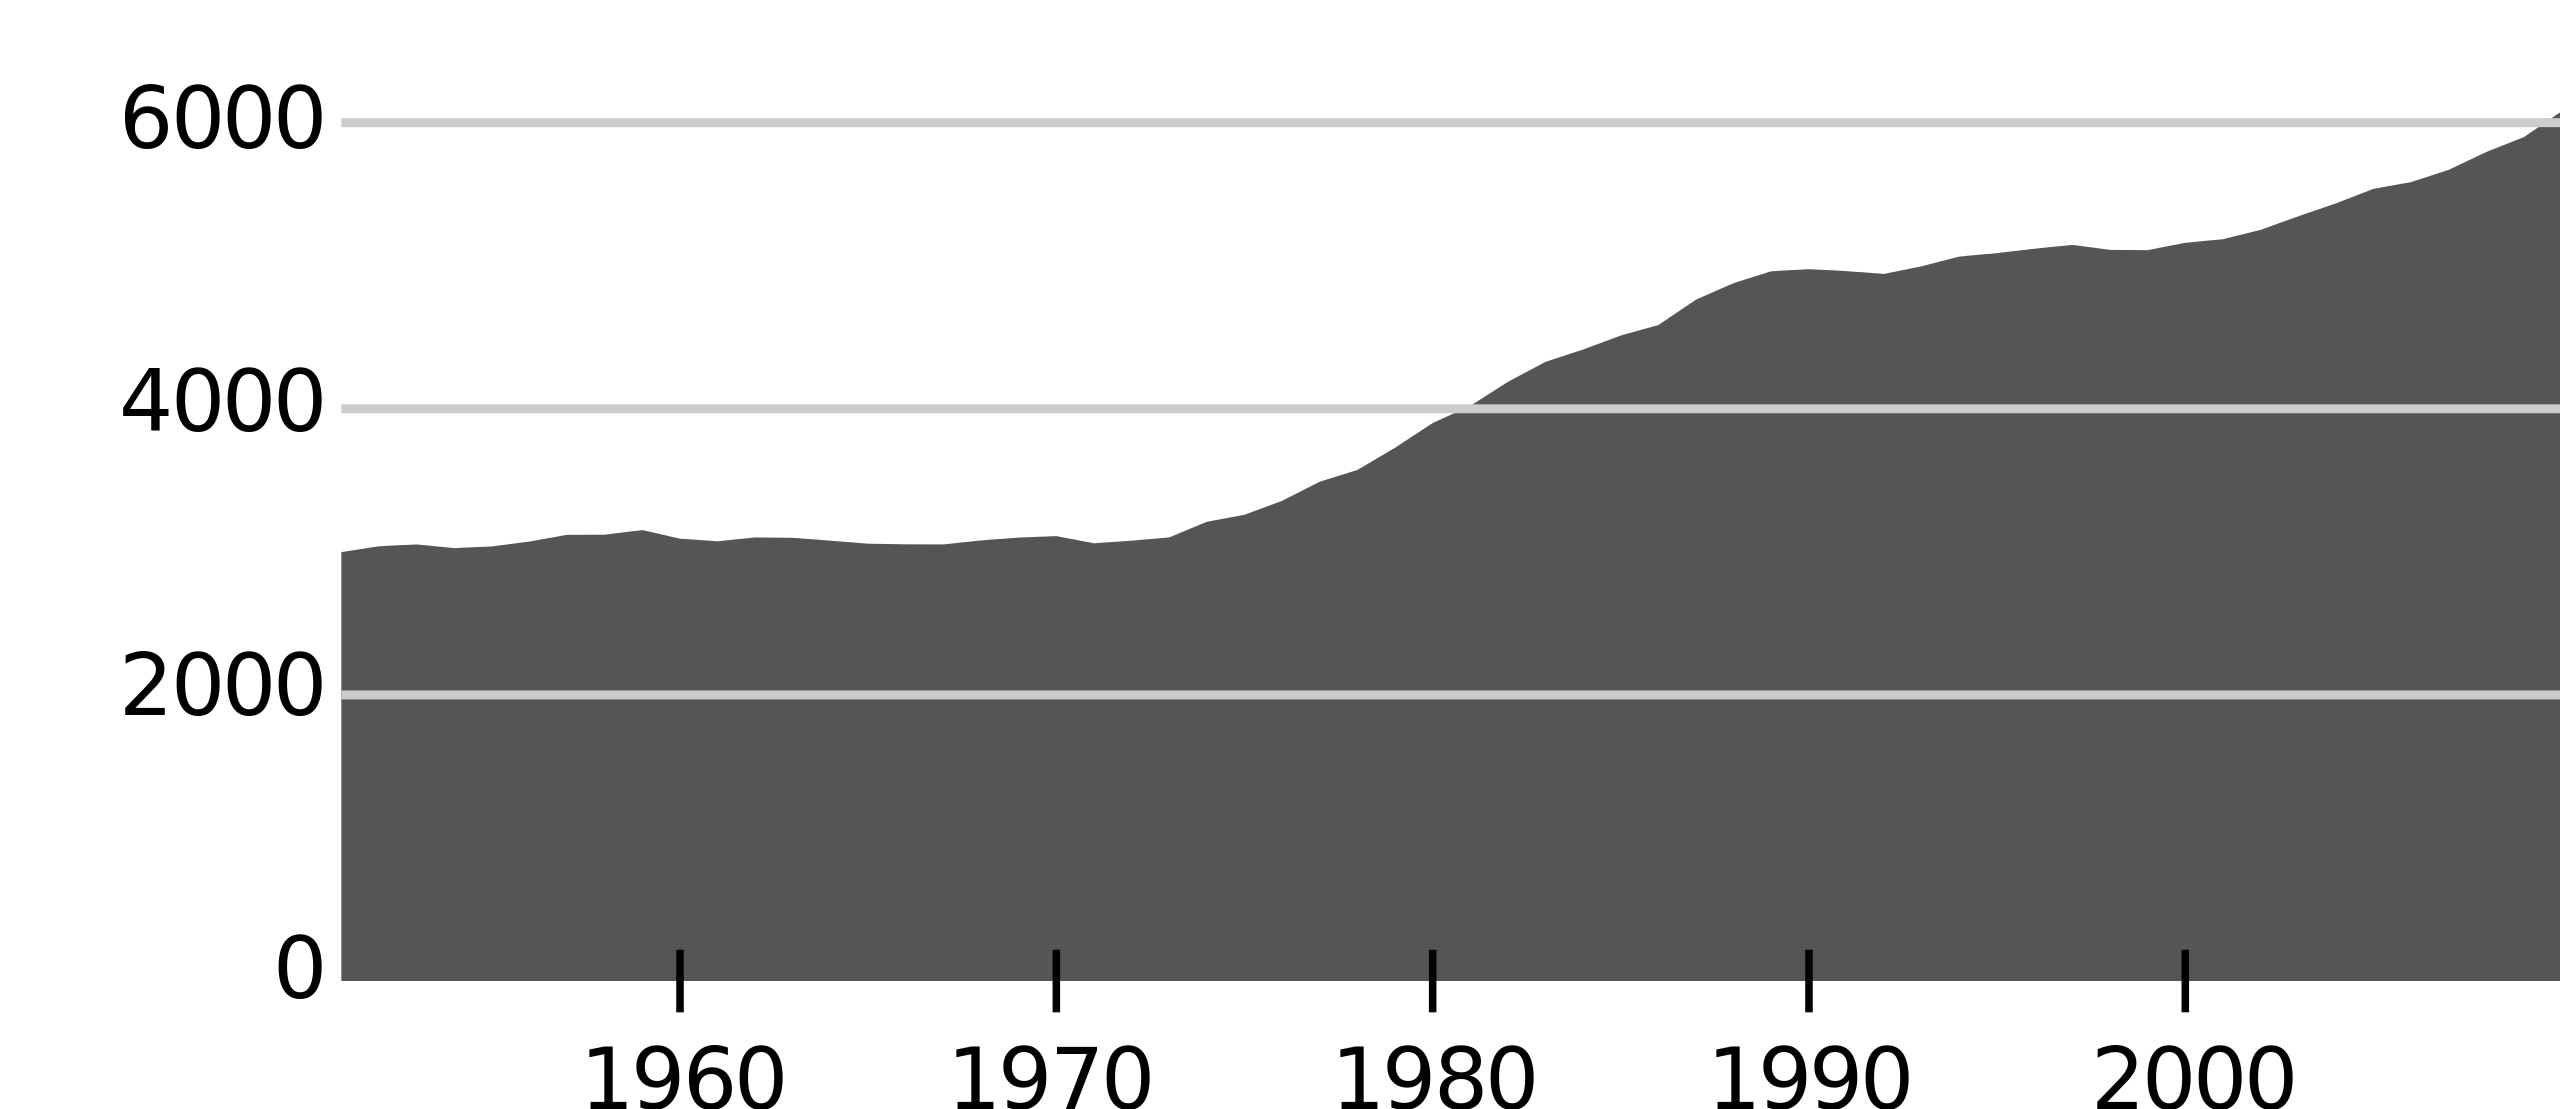
Befolkningsutvikling_kommune_1245.svg

Size of this PNG preview of this SVG file:
300 × 130 pixels
.
Other resolutions:
320 × 139 pixels
|
640 × 277 pixels
|
1,024 × 444 pixels
|
1,280 × 555 pixels
|
2,560 × 1,109 pixels
.
| Description | Population development graph for Norwegian municipalities 1951-current year ( file will be updated annually ). Vertical red bars indicate changed municipal borders, mergers, etc. (specified in source). |
| Date | |
| Source | Own work, data source is Statistics Norway's website |
| Author | Btd |
|
Permission
( Reusing this file ) |
The material on [ssb.no] (text, statistical tables and diagrams) may be stored electronically, printed, copied and forwarded to other parties. The permission is given on the provision that reference is made to the source from which the material is obtained (Source: Statistics Norway). The source shall be quoted in direct connection with each table and diagram that is used. [1] |

|
The copyright holder of this file, Statistics Norway , allows anyone to use it for any purpose, provided that the copyright holder is properly attributed. Redistribution, derivative work, commercial use, and all other use is permitted. |
|
Attribution:
Statistics Norway
|