Births_and_Total_fertility_rate_of_Japan.svg

Size of this PNG preview of this SVG file:
800 × 400 pixels
.
Other resolutions:
320 × 160 pixels
|
640 × 320 pixels
|
1,024 × 512 pixels
|
1,280 × 640 pixels
|
2,560 × 1,280 pixels
|
900 × 450 pixels
.

|
This file may be updated to reflect new information.
If you wish to use a specific version of the file without new updates being mirrored, please upload the required version as a separate file. |
Summary
| Description |
English:
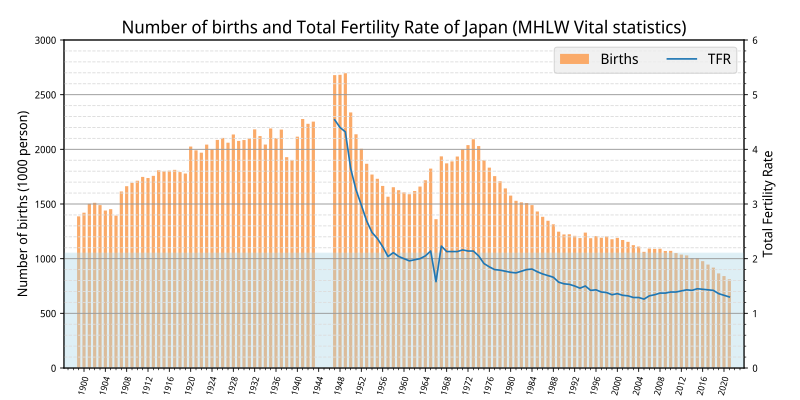
Births and Total fertility rate of Japan
|
| Date | |
| Source |
Own work , Data from
|
| Author | Yuasan |
|
Permission
( Reusing this file ) |
CC-0 |
Licensing
I, the copyright holder of this work, hereby publish it under the following license:
|
|
This file is made available under the Creative Commons CC0 1.0 Universal Public Domain Dedication . |
|
The person who associated a work with this deed has dedicated the work to the
public domain
by waiving all of their rights to the work worldwide under copyright law, including all related and neighboring rights, to the extent allowed by law. You can copy, modify, distribute and perform the work, even for commercial purposes, all without asking permission.
|
graph data
import matplotlib.pyplot as plt
from cycler import cycler
import pandas as pd
import numpy as np

df = pd.read_csv("data.tsv", index_col=0 , sep = "\t")

df1 = df.T.loc['TFR']		# line
df1 = df1.fillna(method='ffill')
df2 = df.T.loc['Births'].div(1000)	# bar

fig, ax = plt.subplots(figsize=(10, 5))
ax2 = ax.twinx()
plt.rcParams['font.family'] = 'sans-serif'
plt.rcParams['font.sans-serif'] = ['Noto Sans Display']

plt.subplots_adjust(left=0.08, bottom=0.08, right=0.93, top=0.90)

ax.bar(df2.index, df2, color="#FAAA69", width=0.6, label="Births")
ax.set_axisbelow(True)
ax.tick_params(axis='x', labelrotation=75)
ax.set_ylabel("Number of births (1000 person)", fontsize=12)
ax.set_ylim([0,3000])

ax2.set_ylabel("Total Fertility Rate", fontsize=12)
ax2.set_ylim([0,6])
ax2.axhspan(0,2.1, color="lightblue", alpha=0.4 , zorder=-10)
ax2.set_prop_cycle( plt.rcParams['axes.prop_cycle'] )
ax2.plot(df1, label="TFR")

ax.margins(0.02)
ax2.margins(0.02)

lines, labels = ax.get_legend_handles_labels()
lines2, labels2 = ax2.get_legend_handles_labels()
ax2.legend(lines + lines2, labels + labels2, facecolor="#eeeeee" ,
           ncol=2, fontsize=13,loc='upper right')

plt.title("Number of births and Total Fertility Rate of Japan (MHLW Vital statistics)", fontsize=16)

plt.setp(ax.get_xticklabels(), fontsize=8)
plt.setp(ax.get_yticklabels(), fontsize=9)
plt.xticks(np.arange(1900, 2021, step=4), fontsize=9)
plt.tick_params(labelsize=9, pad=4)

plt.minorticks_on()
plt.grid(which='major',color='#999999',linestyle='-', axis="y")
plt.grid(which='minor',color='#dddddd',linestyle='--', axis="y")

plt.savefig("image.svg")