Boundary_layer_separation.svg

Size of this PNG preview of this SVG file:
800 × 458 pixels
.
Other resolutions:
320 × 183 pixels
|
640 × 367 pixels
|
1,024 × 586 pixels
|
1,280 × 733 pixels
|
2,560 × 1,466 pixels
|
1,011 × 579 pixels
.
Summary
| Description |
English:
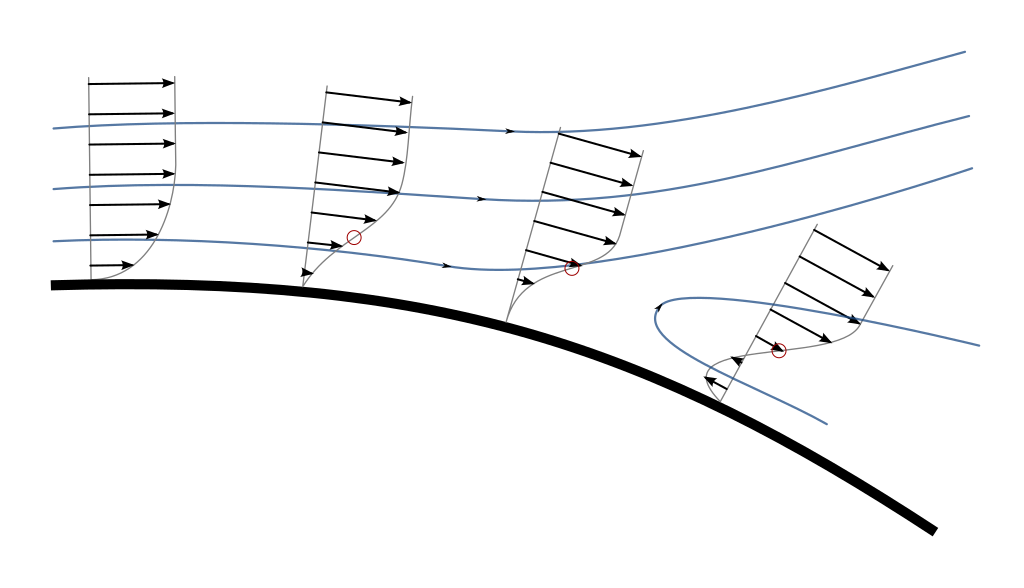
Diagram showing the change in the velocity distribution within a boundary layer around the separation. For clarity, the scale perpendicular to the surface (and thus the boundary layer thickness) is greatly exaggerated with respect to the longitudinal distance.
|
| Date | |
| Source | Own work |
| Author | Olivier Cleynen |
| SVG development |
Licensing
I, the copyright holder of this work, hereby publish it under the following license:
This file is licensed under the
Creative Commons
Attribution 3.0 Unported
license.
-
You are free:
- to share – to copy, distribute and transmit the work
- to remix – to adapt the work
-
Under the following conditions:
- attribution – You must give appropriate credit, provide a link to the license, and indicate if changes were made. You may do so in any reasonable manner, but not in any way that suggests the licensor endorses you or your use.