Budget_Deficit_and_Public_Debt_to_GDP_in_2012_(for_selected_EU_Members).png

Size of this preview:
800 × 600 pixels
.
Other resolutions:
320 × 240 pixels
|
640 × 480 pixels
|
960 × 720 pixels
.
Summary
| Description |
English:
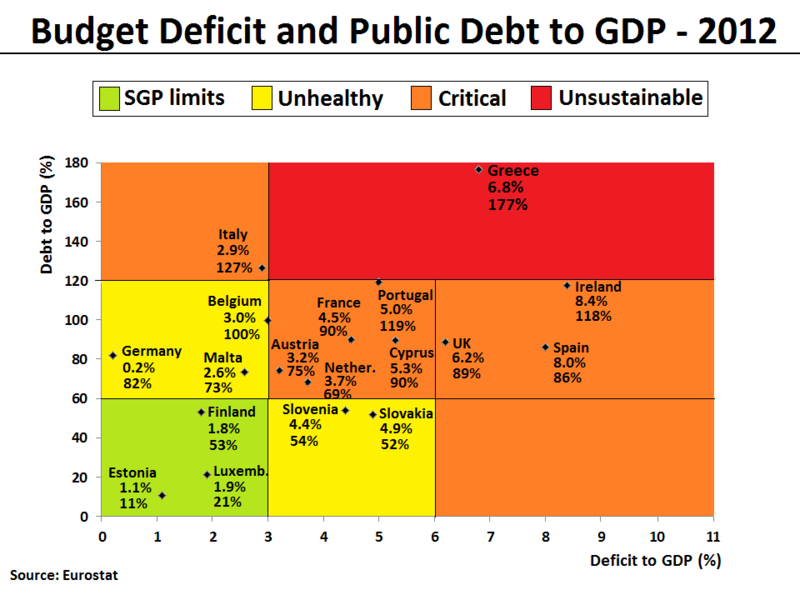
The Debt-to-GDP ratio and Budget deficit to GDP ratio have been plotted for all eurozone countries and UK in 2012. The same plot can also be found here with
2009 figures
. The figures indicate the fiscal health of the countries in the plot. Generally, the farther up and to the right a country goes, the higher the risk for investors. The following 4 areas have been given a background color in the plot to reflect the level of fiscal health:
|
| Date | |
| Source | Own work . Data for the chart is from the Eurostat database [1] [2] , which normally will be identical with the European Commision's AMECO database [3] [4] . In the current version of the file, the figures are based on recorded data for the first 3 quarters and forecasted data for the last 4th quarter of 2012. The data can also be found published by the European Commission's latest Autumn Economic Forecast 2012 report . |
| Author | Danish Expert |
| Other versions | العربيَّة |
.png)
-ar.png)

|
This
graph
image could be re-created
using
vector graphics
as an
SVG
file
. This has several advantages; see
Commons:Media for cleanup
for more information. If an SVG form of this image is available, please upload it and afterwards replace this template with
{{

vector version available

|

new image name

}}
.
It is recommended to name the SVG file “Budget Deficit and Public Debt to GDP in 2012 (for selected EU Members).svg”—then the template Vector version available (or Vva ) does not need the new image name parameter. |
Licensing
I, the copyright holder of this work, hereby publish it under the following license:
This file is licensed under the
Creative Commons
Attribution-Share Alike 3.0 Unported
license.
-
You are free:
- to share – to copy, distribute and transmit the work
- to remix – to adapt the work
-
Under the following conditions:
- attribution – You must give appropriate credit, provide a link to the license, and indicate if changes were made. You may do so in any reasonable manner, but not in any way that suggests the licensor endorses you or your use.
- share alike – If you remix, transform, or build upon the material, you must distribute your contributions under the same or compatible license as the original.