CQT-piano-chord.png
No higher resolution available.
Summary
| Description |
English:
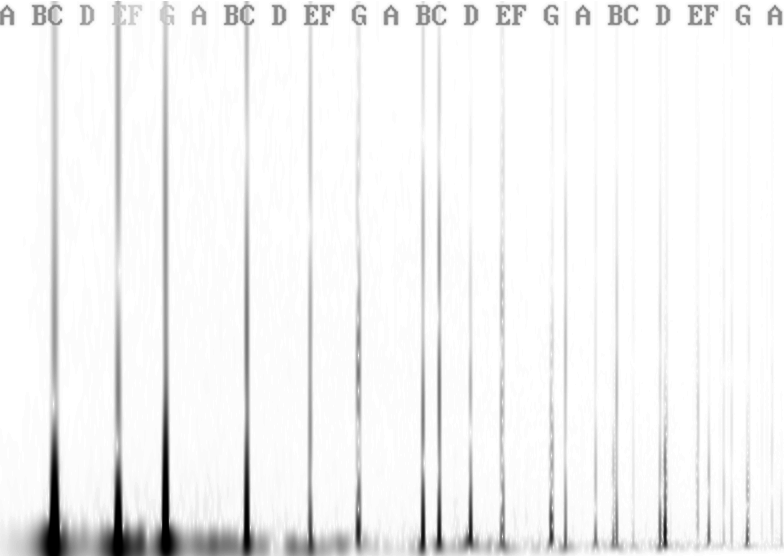
The result of a
constant-Q transform
applied to the waveform of a C major chord played on a piano. The x axis corresponds to frequency mapped to the standard pitch names (increasing from lower pitches on the left to higher frequencies on the right). The y axis is time, with the start of the piano chord happening at the bottom and the release happening at the top (approximately 8 seconds later)
The darker areas correspond to higher values of the constant Q transform. The peak values are vibrating frequencies of the strings. The leftmost 3 strongest peaks are at the fundamental frequencies of the notes of the C major chord (C, E, G). The the remaining peaks to the right of the fundamental frequencies are overtones . Note that Brown-Puckette algorithm on the showcqt uses kernels derived directly from frequency domain, the bandwidth calculation is actually variable-Q , and showcqt uses linear/nth root amplitude scaling rather than logarithmic. |
| Date | |
| Source | Own work |
| Author | Em3rgent0rdr |
Licensing
I, the copyright holder of this work, hereby publish it under the following license:
This file is licensed under the
Creative Commons
Attribution-Share Alike 4.0 International
license.
-
You are free:
- to share – to copy, distribute and transmit the work
- to remix – to adapt the work
-
Under the following conditions:
- attribution – You must give appropriate credit, provide a link to the license, and indicate if changes were made. You may do so in any reasonable manner, but not in any way that suggests the licensor endorses you or your use.
- share alike – If you remix, transform, or build upon the material, you must distribute your contributions under the same or compatible license as the original.