DJIA_historical_graph_(log).svg

|
|
This file is
translated using SVG
<switch>
elements
. All translations are stored in the same file!
Learn more
.
For most Wikipedia projects, you can embed the file normally (without a
To translate the text into your language, you can use the SVG Translate tool . Alternatively, you can download the file to your computer, add your translations using whatever software you're familiar with, and re-upload it with the same name. You will find help in Graphics Lab if you're not sure how to do this. |
.svg)
Summary
| Description |
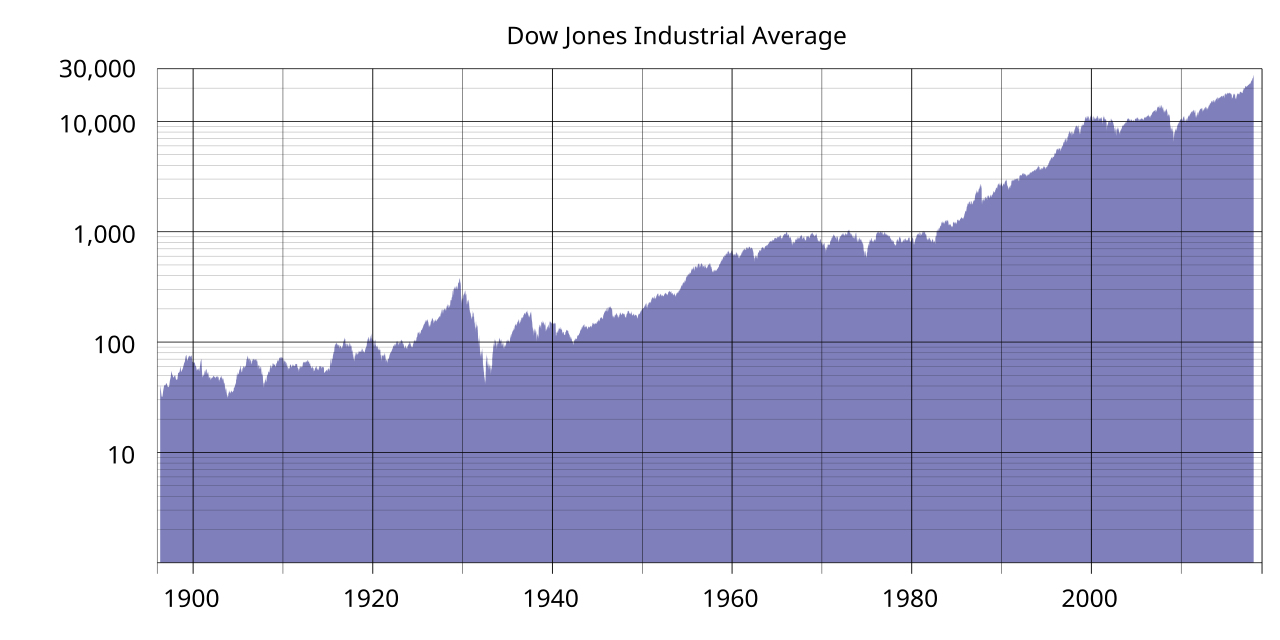
Same as en:Image:DJIA historical graph.svg , except logarithmic rather than linear. Log 10 applied to all values. From May, 1896 - Dec, 1900: monthly closings; Source: [1] From Jan 4, 1901 - Dec 30, 2011: daily closings; Source: [2] From Jan 3, 2012 - present; Source: [3] See also: Linear version |
| Date | 6 May 2007 (original upload date) |
| Source | Transferred from en.wikipedia to Commons. |
| Author | Lalala666 at English Wikipedia |
| Other versions | Derivative works of this file: DJIA historical graph (log)-2008-29-10.svg |
-2008-29-10.svg)
Licensing
|
|
This work has been released into the
public domain
by its author,
Lalala666
at
English Wikipedia
. This applies worldwide.
In some countries this may not be legally possible; if so: Lalala666 grants anyone the right to use this work for any purpose , without any conditions, unless such conditions are required by law. |
Original upload log
- 2007-05-06 03:17 Lalala666 800×400×0 (670977 bytes) Less precision, maybe the SVG rasterizer will like this one better :/
- 2007-05-06 03:08 Lalala666 800×400×0 (800817 bytes) Same as [[:Image:DJIA historical graph.svg]], except logarithmic rather than linear. Log<sub>10</sub> applied to all values. Daily closings from Jan 4 1901 to Apr 27 2007.