Demographic_change_in_Sweden_1735-2000.png
No higher resolution available.

|
This
graph
image could be re-created
using
vector graphics
as an
SVG
file
. This has several advantages; see
Commons:Media for cleanup
for more information. If an SVG form of this image is available, please upload it and afterwards replace this template with
{{

vector version available

|

new image name

}}
.
It is recommended to name the SVG file “Demographic change in Sweden 1735-2000.svg”—then the template Vector version available (or Vva ) does not need the new image name parameter. |
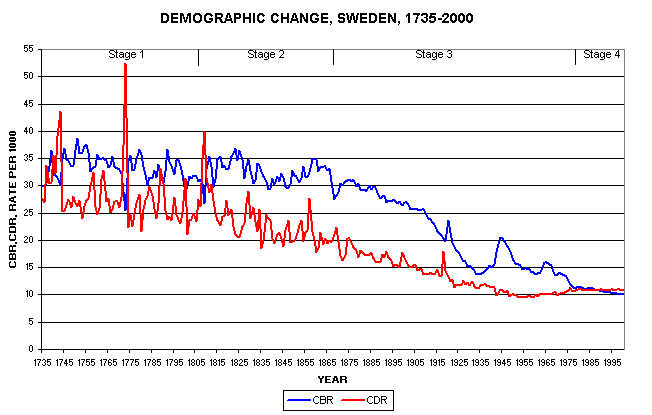
Graph showing demographic change in Sweden over the time period. A good example of a en:Demographic transition .
Taken with permission from [1]
This file is licensed under the
Creative Commons
Attribution 2.5 Generic
license.
-
You are free:
- to share – to copy, distribute and transmit the work
- to remix – to adapt the work
-
Under the following conditions:
- attribution – You must give appropriate credit, provide a link to the license, and indicate if changes were made. You may do so in any reasonable manner, but not in any way that suggests the licensor endorses you or your use.
Original upload log
| Date/Time | Dimensions | User | Comment |
|---|---|---|---|
| 14 July 2005, 09:13:33 | 652 × 415 (9835 bytes) | Komencanto ( talk · contribs ) | Graph showing demographic change in Sweden over the time period. A good example of a [[en:Demographic transition]]. Taken with permission from [http://www.uwmc.uwc.edu/geography/Demotrans/demtran.htm] {{cc-by-2.5}} |