Energy_through_phase_changes.png

Size of this preview:
800 × 517 pixels
.
Other resolutions:
320 × 207 pixels
|
640 × 413 pixels
|
960 × 620 pixels
.
Summary
| Description |
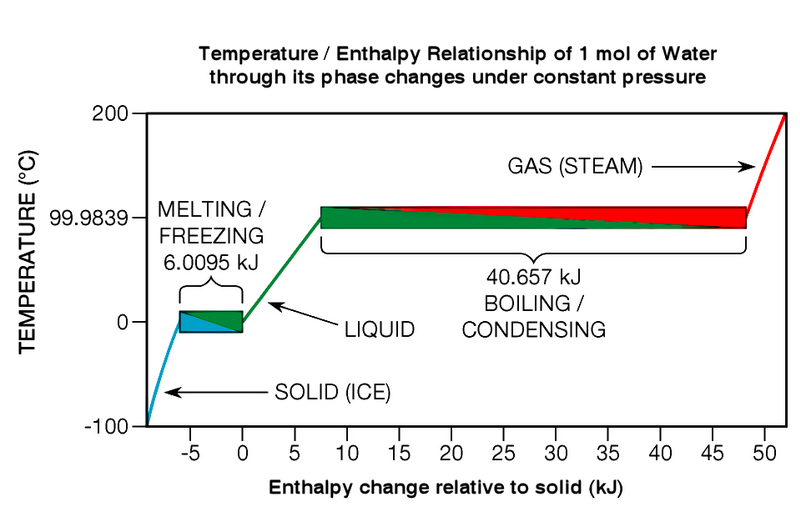
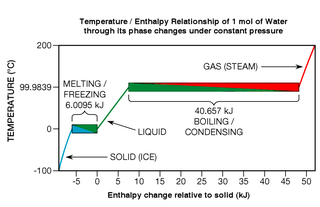
English:
Temperature Enthaply relationship of 1 mol of water through its phase changes under constant pressure. This graph shows that the temperature of a water sample does not change during phase transitions as heat flows in or out of it. The total heat capacity of a mole of water in its liquid phase (the green line) is 7.5507 kJ.
|
| Date | 20 July 2006T00:16:56Z |
| Source | Own work |
| Author | Greg L |
| Other versions |


|
This
diagram
image could be re-created
using
vector graphics
as an
SVG
file
. This has several advantages; see
Commons:Media for cleanup
for more information. If an SVG form of this image is available, please upload it and afterwards replace this template with
{{

vector version available

|

new image name

}}
.
It is recommended to name the SVG file “Energy through phase changes.svg”—then the template Vector version available (or Vva ) does not need the new image name parameter. |
Licensing
Greg L
at the
English-language Wikipedia
, the copyright holder of this work, hereby publishes it under the following license:
|
|
This file is licensed under the Creative Commons Attribution-Share Alike 3.0 Unported license. Subject to disclaimers . | |
| Attribution: Greg L at the English-language Wikipedia | ||
|
||
| This licensing tag was added to this file as part of the GFDL licensing update . |

|
Permission is granted to copy, distribute and/or modify this document under the terms of the GNU Free Documentation License , Version 1.2 or any later version published by the Free Software Foundation ; with no Invariant Sections, no Front-Cover Texts, and no Back-Cover Texts. A copy of the license is included in the section entitled GNU Free Documentation License . Subject to disclaimers . |

|
This media file is uncategorized.
Please help improve this media file by adding it to one or more categories, so it may be associated with related media files (
how?
), and so that it can be more easily found.
Please notify the uploader with
{{subst:Please link images|File:Energy through phase changes.png}} ~~~~
|