Exoplanet_Discovery_Methods_Bar.png

Size of this preview:
800 × 478 pixels
.
Other resolutions:
320 × 191 pixels
|
640 × 382 pixels
|
1,024 × 611 pixels
|
1,280 × 764 pixels
|
2,560 × 1,528 pixels
|
8,040 × 4,800 pixels
.
Summary
| Description |
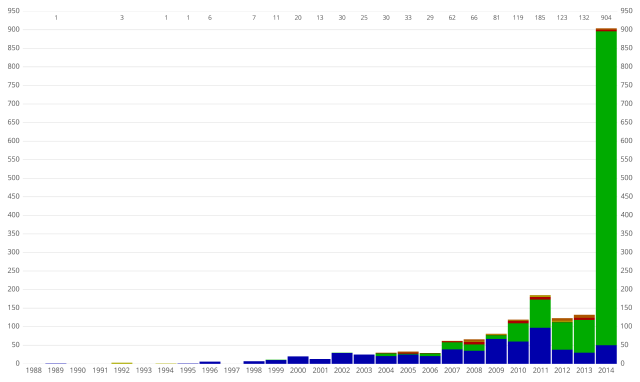
English:
Bar chart of
exoplanet
discoveries by year, through 2015-01-01, indicating the
discovery method
using distinct colors:
radial velocity
(dark blue)
transit
(dark green)
timing
(dark yellow)
direct imaging
(dark red)
microlensing
(dark orange)
Exoplanet data is from the Open Exoplanet Catalogue, [1] version 298ee46
|
| Date | |
| Source | Own work |
| Author | Aldaron , a.k.a. Aldaron |
| Other versions |
Other versions and formats
Graphs for individual methodsRelated graphs
|


Licensing :
|
|
I, the copyright holder of this work, release this work into the
public domain
. This applies worldwide.
In some countries this may not be legally possible; if so: I grant anyone the right to use this work for any purpose , without any conditions, unless such conditions are required by law. |
Alternate formats

|
File:Exoplanet Discovery Methods Bar.svg
is a vector version of this file. It should be used in place of this PNG file when not inferior.
File:Exoplanet Discovery Methods Bar.png →
File:Exoplanet Discovery Methods Bar.svg
For more information, see
Help:SVG
.
|

|