Final_2008_electoral_cartogram.png
No higher resolution available.
Summary
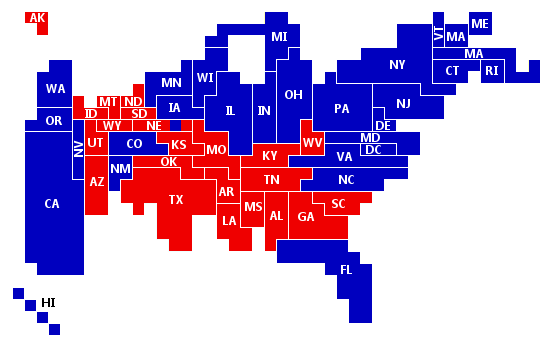
| Description | Final 2008 electoral college cartogram. Blue squares represent electoral votes for Obama-Biden. Red squares represent electoral votes for McCain-Palin. Note that this cartogram is topologically correct in that any two states which touch in reality touch on this cartogram. The cartogram has been published in J.R. Gott and W.N. Colley's 2008 paper, "Median Statistics in Polling" in Mathematical and Computer Modeling . |
| Date | 19 December 2008 (original upload date) |
| Source | No machine-readable source provided. Own work assumed (based on copyright claims). |
| Author | No machine-readable author provided. Wes colley assumed (based on copyright claims). |
Licensing
I, the copyright holder of this work, hereby publish it under the following licenses:
This file is licensed under the
Creative Commons
Attribution-Share Alike 3.0 Unported
license.
-
You are free:
- to share – to copy, distribute and transmit the work
- to remix – to adapt the work
-
Under the following conditions:
- attribution – You must give appropriate credit, provide a link to the license, and indicate if changes were made. You may do so in any reasonable manner, but not in any way that suggests the licensor endorses you or your use.
- share alike – If you remix, transform, or build upon the material, you must distribute your contributions under the same or compatible license as the original.

|
Permission is granted to copy, distribute and/or modify this document under the terms of the GNU Free Documentation License , Version 1.2 or any later version published by the Free Software Foundation ; with no Invariant Sections, no Front-Cover Texts, and no Back-Cover Texts. A copy of the license is included in the section entitled GNU Free Documentation License . |
You may select the license of your choice.