Food_web_of_the_Venice_lagoon.png
Size of this preview:
800 × 474 pixels
.
Other resolutions:
320 × 190 pixels
|
640 × 379 pixels
|
1,024 × 607 pixels
|
1,413 × 837 pixels
.
Summary
| Description |
English:
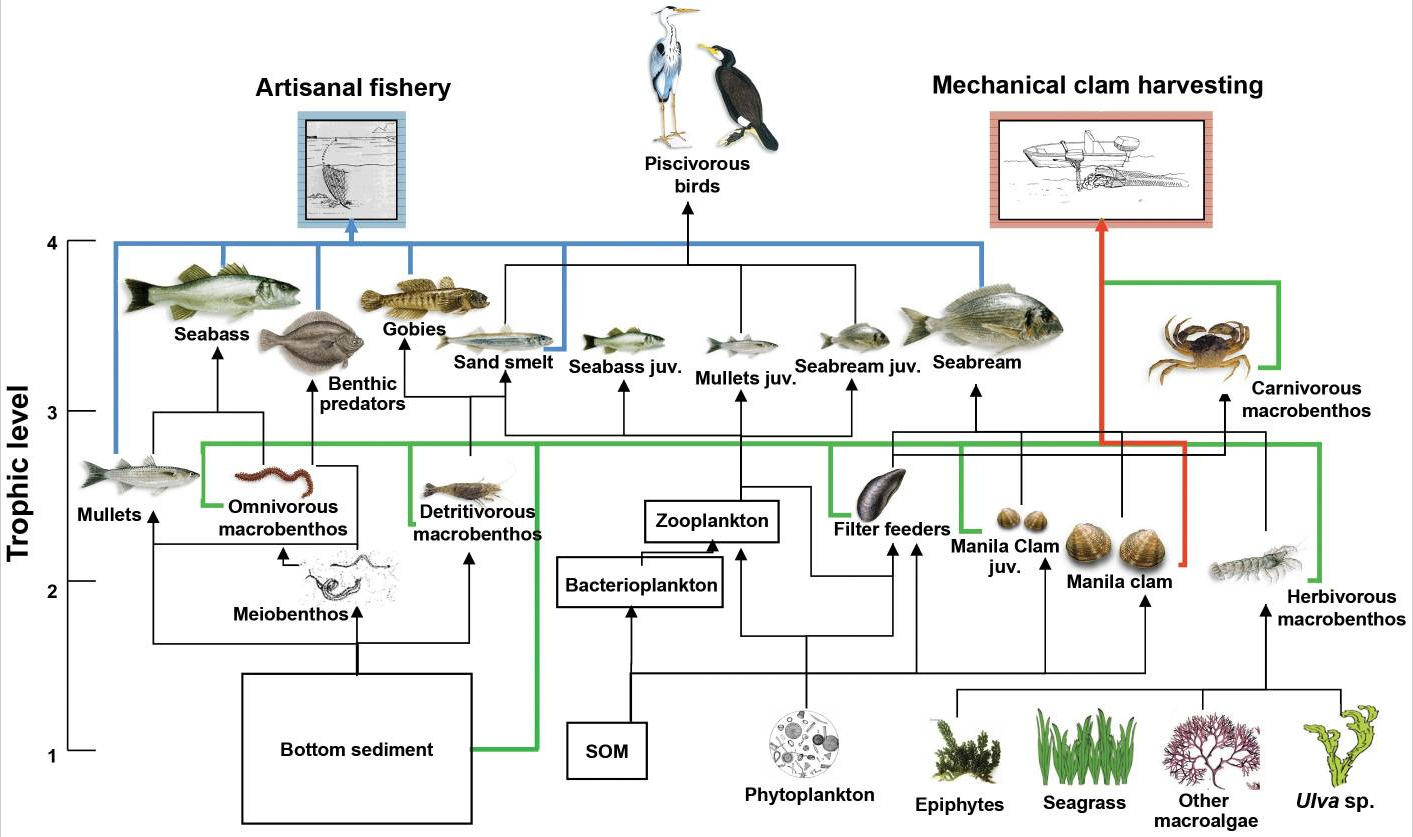
Food web diagram of the Venice lagoon with 27 nodes or functional groups.
Colors of flows depict different fishing target (artisanal fisheries in blue, and clam fishery in red) and non-target species (for clam harvesting, in green). Modified from: Pranovi, F., Libralato, S., Raicevich, S., Granzotto, A., Pastres, R. and Giovanardi, O. (2003)." Mechanical clam dredging in Venice lagoon: ecosystem effects evaluated with a trophic mass-balance model". Marine Biology , 143 (2): 393–403. doi:10.1007/s00227-003-1072-1. |
| Date | |
| Source | PLoS One |
| Author | Heymans, J.J., Coll, M., Libralato, S., Morissette, L. and Christensen, V. |
Licensing
This file is licensed under the
Creative Commons
Attribution 4.0 International
license.
-
You are free:
- to share – to copy, distribute and transmit the work
- to remix – to adapt the work
-
Under the following conditions:
- attribution – You must give appropriate credit, provide a link to the license, and indicate if changes were made. You may do so in any reasonable manner, but not in any way that suggests the licensor endorses you or your use.