G_radiation-level_scale_01.png
Size of this preview:
539 × 599 pixels
.
Other resolutions:
216 × 240 pixels
|
432 × 480 pixels
|
691 × 768 pixels
|
1,250 × 1,389 pixels
.
Summary
| Description |
English:
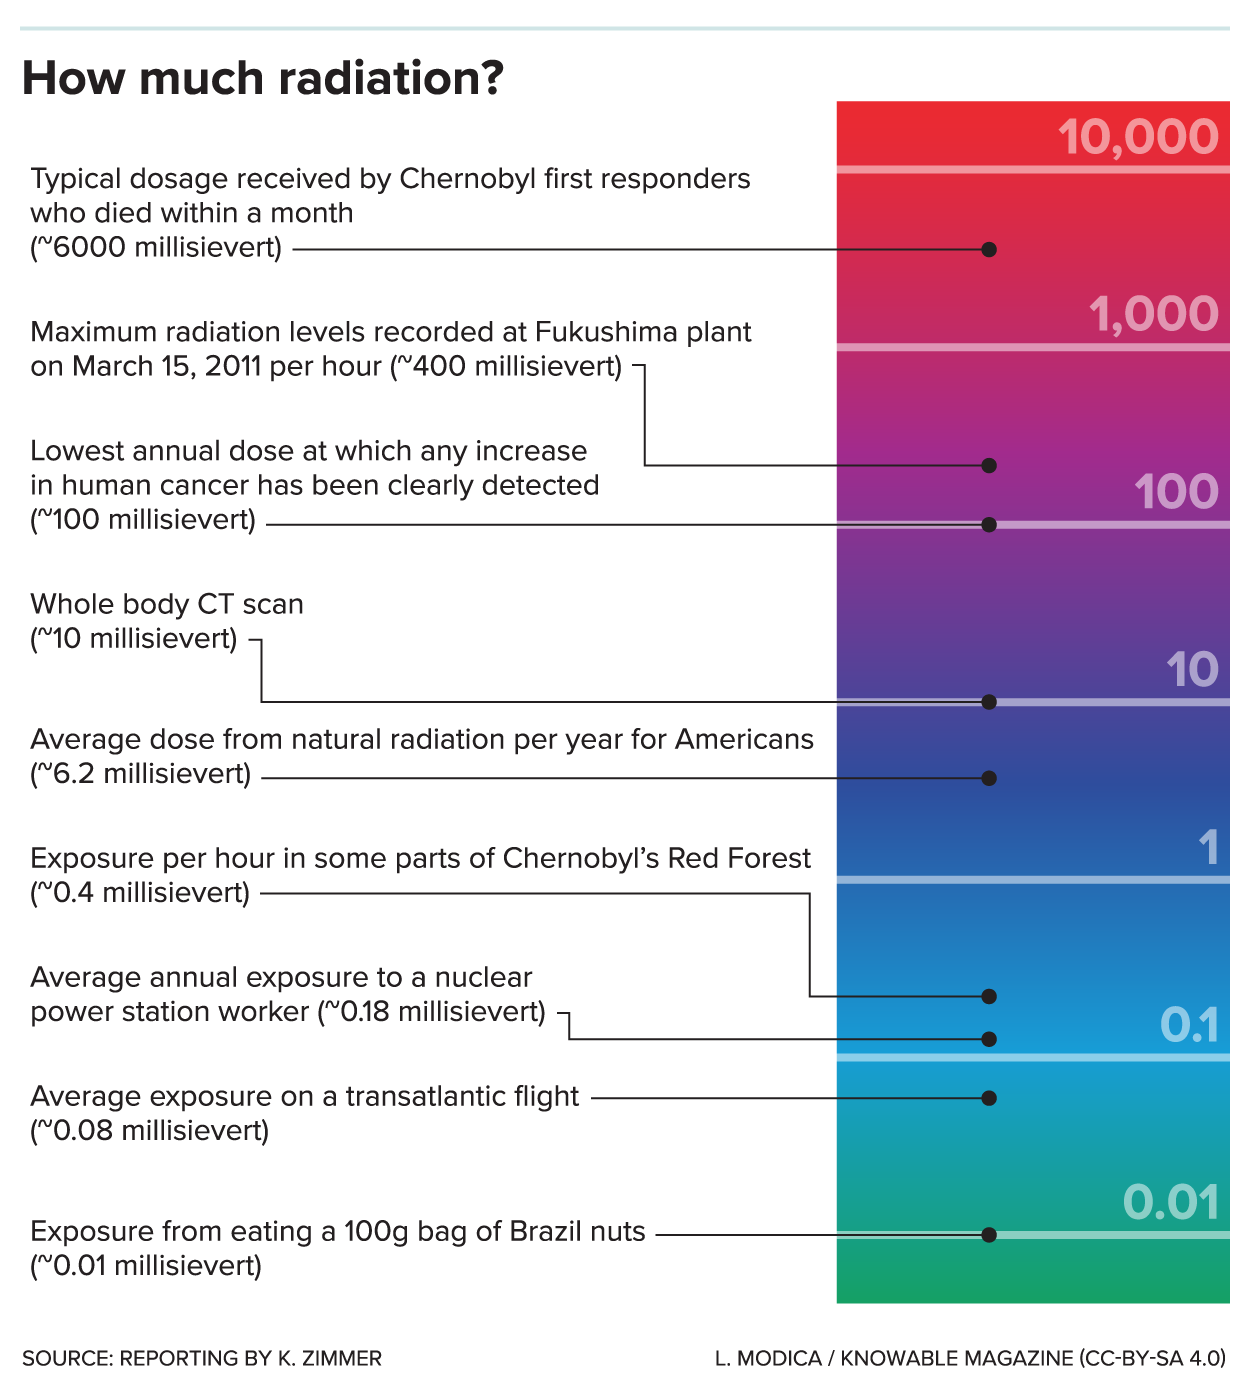
This scale shows radiation levels that might be encountered in a range of situations, from normal activities up to nuclear accidents like Chernobyl or Fukushima. Each step up the scale increases radiation levels tenfold.
|
| Date | |
| Source | "How much radiation". A version of this graphic was created for Zimmer, Katarina (7 February 2022). "Scientists can't agree about Chernobyl's impact on wildlife". Knowable Magazine. doi:10.1146/knowable-020422-1 https://knowablemagazine.org/article/food-environment/2022/scientists-cant-agree-about-chernobyls-impact-wildlife This version of the graphic is being released in png and svg formats by L. Modica / Knowable Magazine under a CC-BY-SA-4.0 license, as shown at the bottom of the image. |
| Author | L. Modica / Knowable Magazine |
| Other versions |
|

Licensing
This file is licensed under the
Creative Commons
Attribution-Share Alike 4.0 International
license.
-
You are free:
- to share – to copy, distribute and transmit the work
- to remix – to adapt the work
-
Under the following conditions:
- attribution – You must give appropriate credit, provide a link to the license, and indicate if changes were made. You may do so in any reasonable manner, but not in any way that suggests the licensor endorses you or your use.
- share alike – If you remix, transform, or build upon the material, you must distribute your contributions under the same or compatible license as the original.