Historical_GDP_growth_of_the_United_States.png
Size of this preview:
800 × 421 pixels
.
Other resolutions:
320 × 168 pixels
|
640 × 336 pixels
|
1,151 × 605 pixels
.
Summary
| Description |
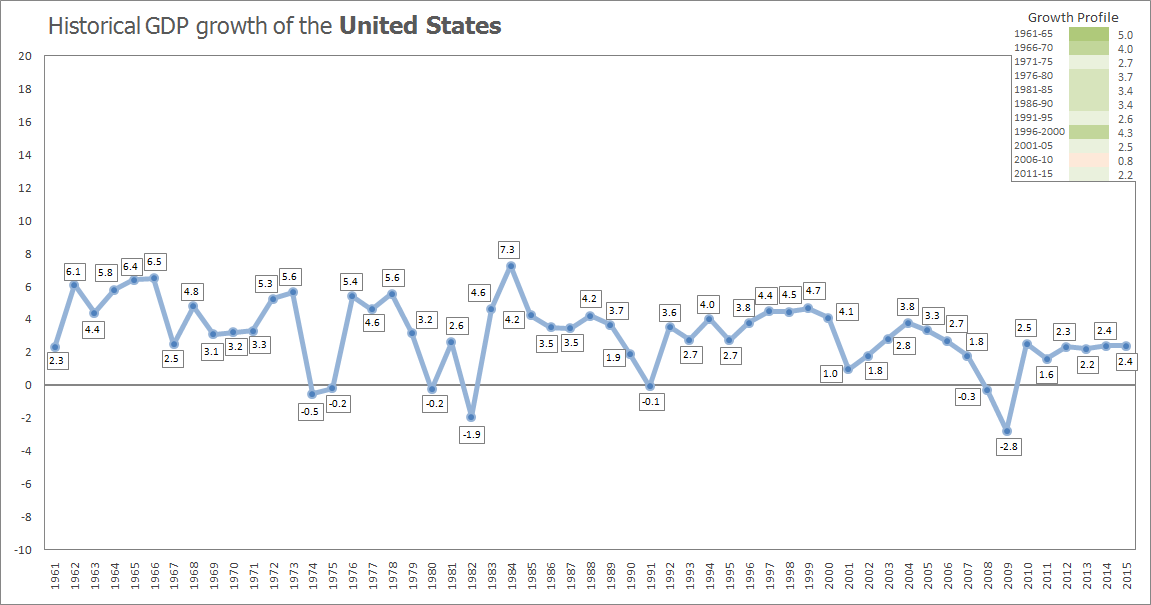
English:
The chart shows the economic growth of the US economy from 1961-2015. Also shown are the five-year averages in the same time frame.
|
| Date | |
| Source | Own work |
| Author | GiovanniMartin16 |
Licensing
I, the copyright holder of this work, hereby publish it under the following license:
This file is licensed under the
Creative Commons
Attribution-Share Alike 4.0 International
license.
-
You are free:
- to share – to copy, distribute and transmit the work
- to remix – to adapt the work
-
Under the following conditions:
- attribution – You must give appropriate credit, provide a link to the license, and indicate if changes were made. You may do so in any reasonable manner, but not in any way that suggests the licensor endorses you or your use.
- share alike – If you remix, transform, or build upon the material, you must distribute your contributions under the same or compatible license as the original.