Induced_fit_diagram.svg

Size of this PNG preview of this SVG file:
648 × 253 pixels
.
Other resolutions:
320 × 125 pixels
|
640 × 250 pixels
|
1,024 × 400 pixels
|
1,280 × 500 pixels
|
2,560 × 1,000 pixels
.
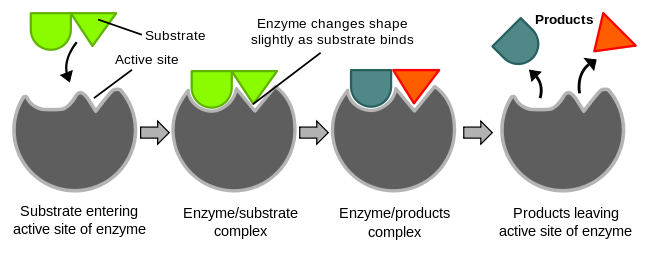
| Description | Diagram illustrating the induced fit model of enzyme activity . | ||
| Date | |||
| Source | Provided by TimVickers | ||
| Author | Created by TimVickers, vectorized by Fvasconcellos | ||
|
Permission
( Reusing this file ) |
|
||
| Other versions |
Derivative works of this file:
|
.svg)
.svg)

|
This SVG file contains embedded text that can be translated into your language, using any capable SVG editor, text editor or the SVG Translate tool . For more information see: About translating SVG files . |