Kinked_demand.svg

Size of this PNG preview of this SVG file:
580 × 480 pixels
.
Other resolutions:
290 × 240 pixels
|
928 × 768 pixels
|
1,237 × 1,024 pixels
|
2,475 × 2,048 pixels
.

|
This SVG file contains embedded text that can be translated into your language, using any capable SVG editor, text editor or the SVG Translate tool . For more information see: About translating SVG files . |
| Description |
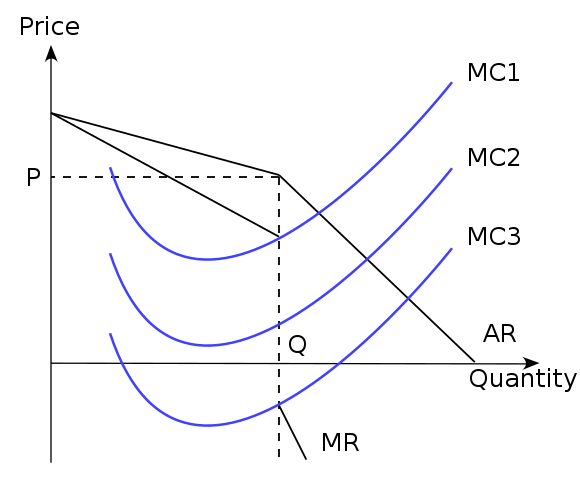
English:
A diagram illustrating
kinked demand
, one formulation for explaining price stability in
oligopolies
. The demand curve the oligopolist faces is that of two separate curves spliced together, creating a discontinuity in the MR curve. This means that a
profit maximising
firm will still produce at quantity Q and price P if marginal costs are equal to MC1, MC2
or
MC3, thus explaining price stability. (Here, both curves are illustrated as linear, though the concept would work exactly the same if they were not.)
|
| Date | (UTC) |
| Source | |
| Author |
|
This file is licensed under the
Creative Commons
Attribution-Share Alike 3.0 Unported
license.
-
You are free:
- to share – to copy, distribute and transmit the work
- to remix – to adapt the work
-
Under the following conditions:
- attribution – You must give appropriate credit, provide a link to the license, and indicate if changes were made. You may do so in any reasonable manner, but not in any way that suggests the licensor endorses you or your use.
- share alike – If you remix, transform, or build upon the material, you must distribute your contributions under the same or compatible license as the original.
Original upload log
This image is a derivative work of the following images:
-
File:Perfect_competition_in_the_short_run.svg
licensed with Cc-by-sa-3.0
- 2010-10-15T16:18:39Z Jarry1250 580x400 (2908 Bytes) == int:filedesc == == int:filedesc == Better economics
- 2010-10-05T20:59:03Z Jarry1250 560x400 (3824 Bytes) == Summary == Economics error fixed.
- 2010-10-05T20:52:52Z Jarry1250 560x400 (3823 Bytes) == Summary == Try to realign again.
- 2010-10-05T20:51:10Z Jarry1250 560x400 (3823 Bytes) == Summary == == Summary == Minor fixes
- 2010-10-05T20:45:52Z Jarry1250 560x400 (3803 Bytes) {{Information |Description={{en|Diagram showing that it is possible that a firm in [[:en:perfect competition|]] makes an [[:en:Economic profit|abnormal profit]], if P > min(ATC). In the [[:en:long run|]], however, only normal
Uploaded with derivativeFX