Moore's_Law_Transistor_Count_1970-2020.png

Size of this preview:
800 × 592 pixels
.
Other resolutions:
320 × 237 pixels
|
640 × 474 pixels
|
1,024 × 758 pixels
|
1,280 × 947 pixels
|
2,560 × 1,894 pixels
|
3,133 × 2,318 pixels
.

|
This
graph
image could be re-created
using
vector graphics
as an
SVG
file
. This has several advantages; see
Commons:Media for cleanup
for more information. If an SVG form of this image is available, please upload it and afterwards replace this template with
{{

vector version available

|

new image name

}}
.
It is recommended to name the SVG file “Moore's Law Transistor Count 1970-2020.svg”—then the template Vector version available (or Vva ) does not need the new image name parameter. |
Summary
| Description |
English:
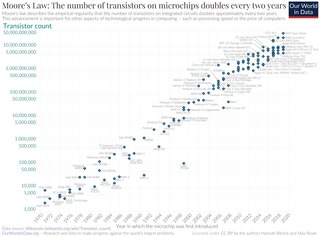
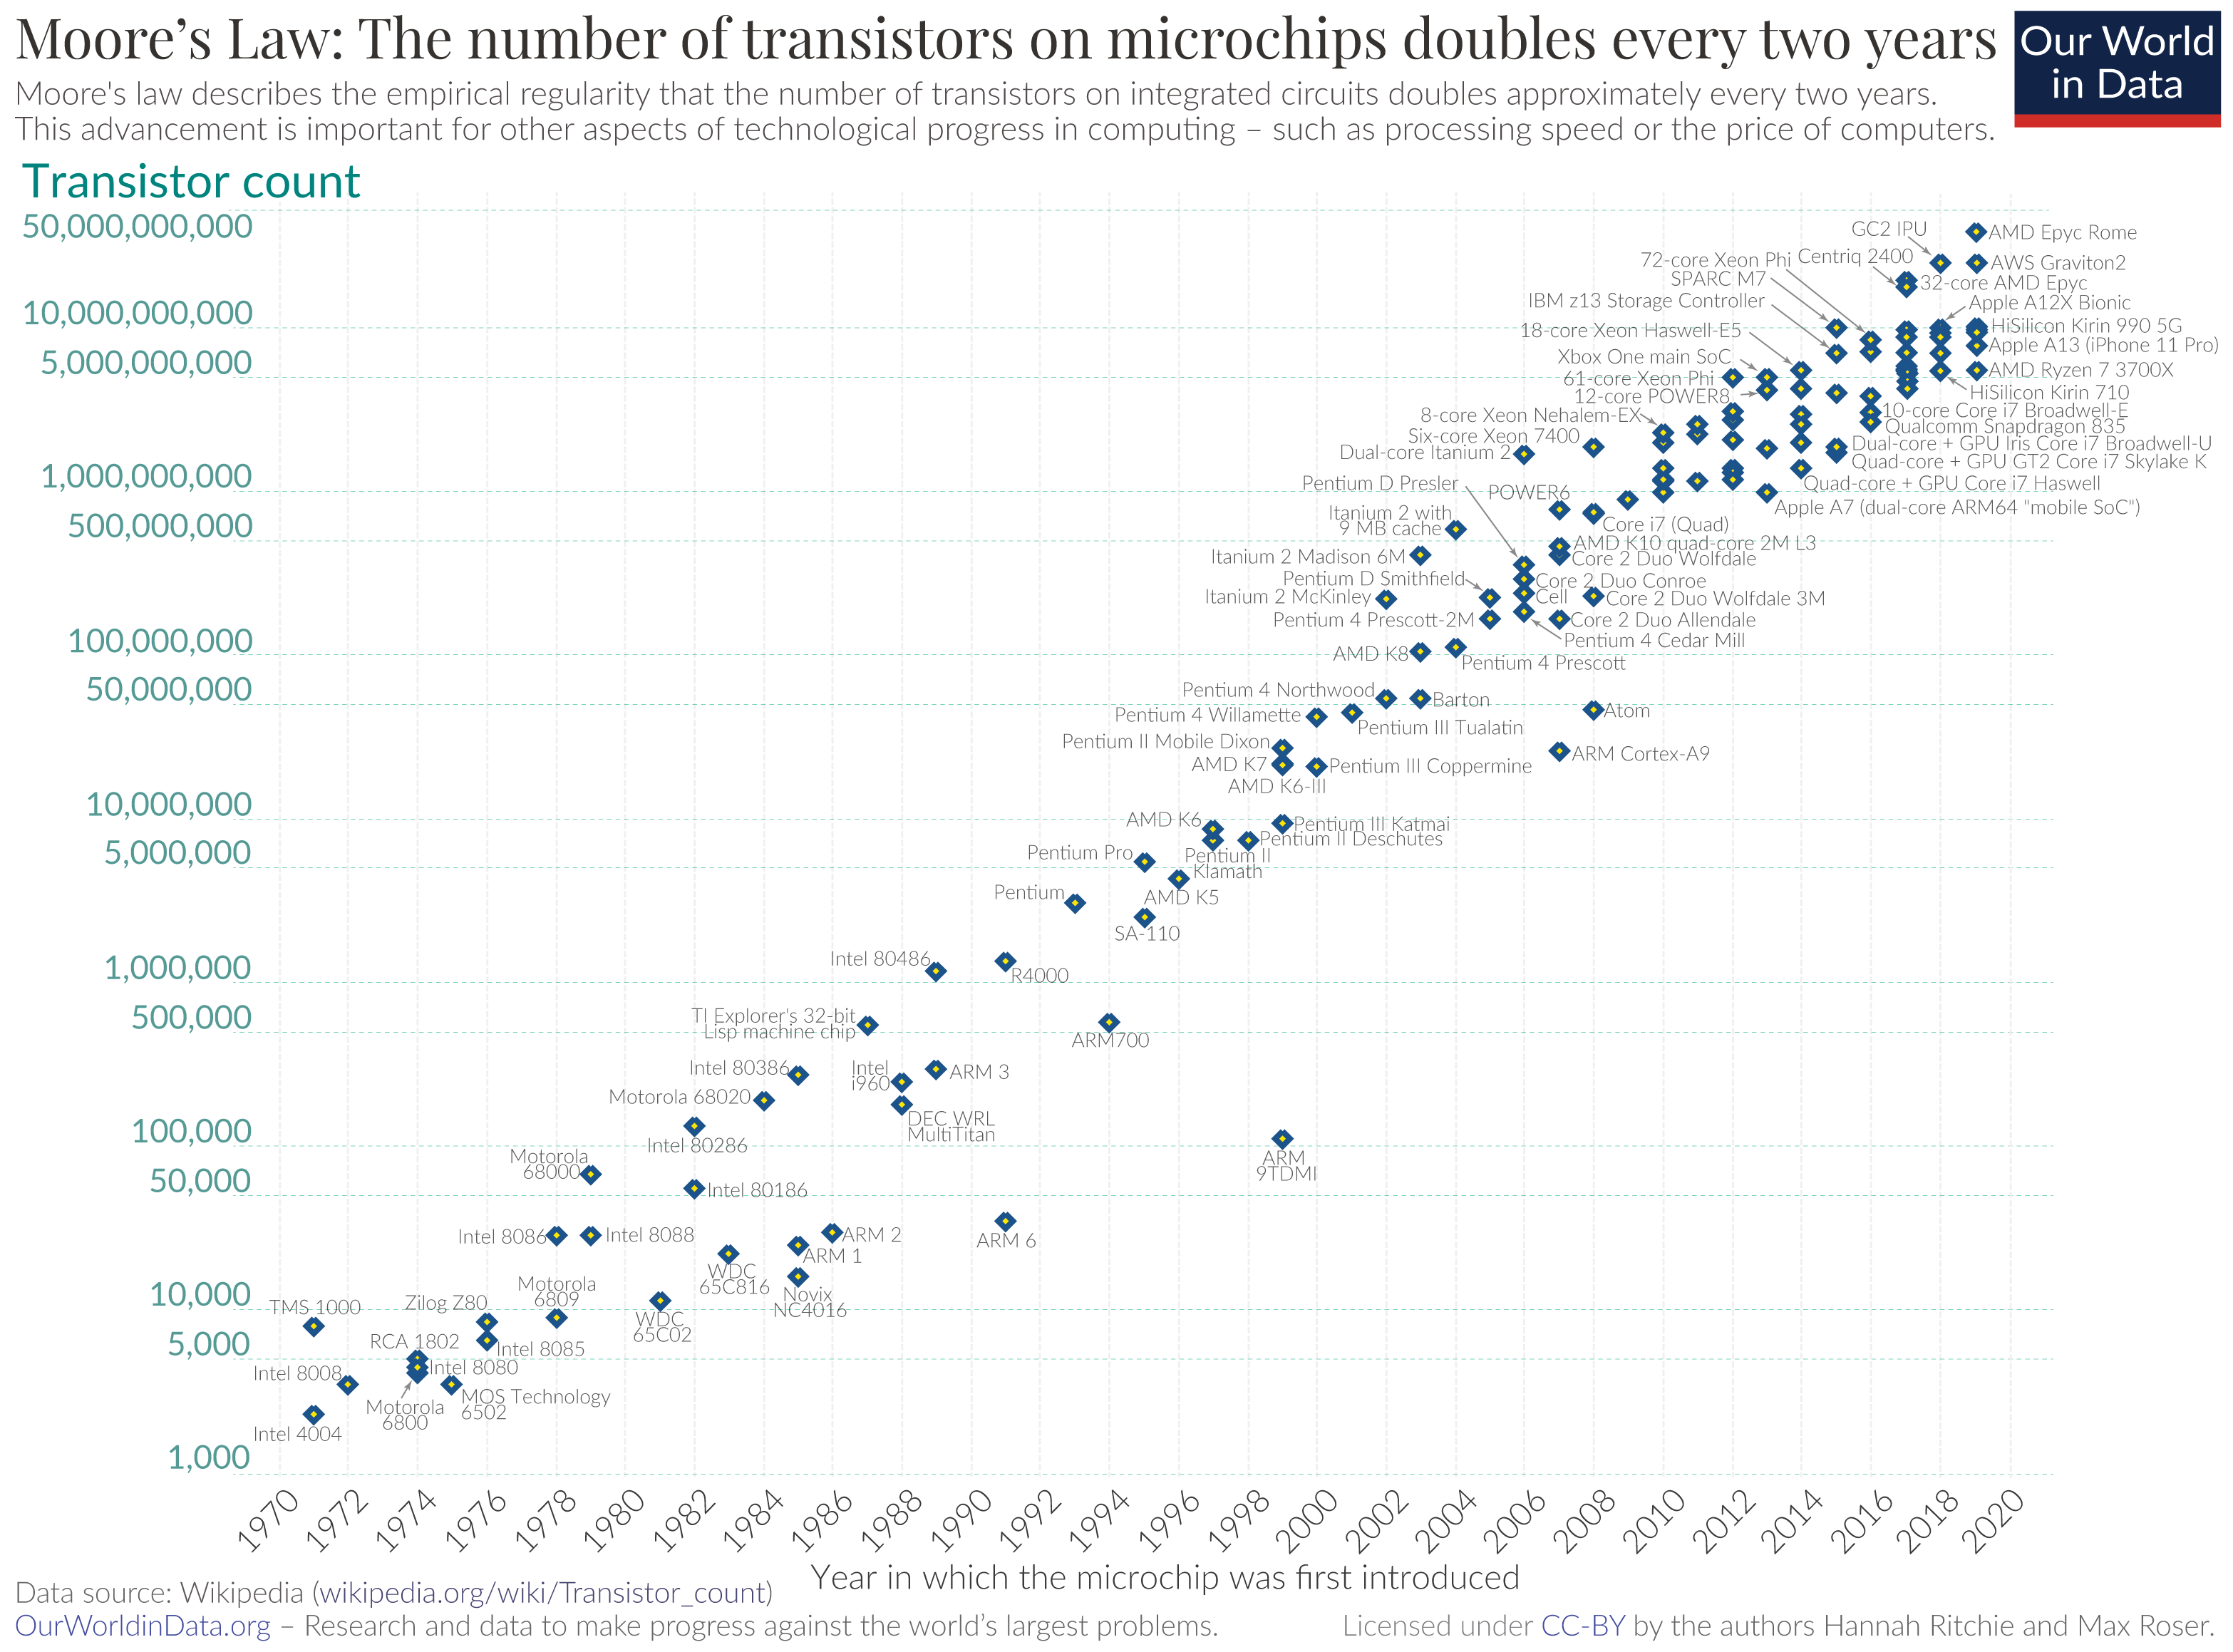
A logarithmic graph showing the timeline of how transistor counts in microchips are almost doubling every two years from 1970 to 2020; Moore's Law.
|
| Date | |
| Source | https://ourworldindata.org/uploads/2020/11/Transistor-Count-over-time.png |
| Author | Max Roser, Hannah Ritchie |
Licensing
This file is licensed under the
Creative Commons
Attribution 4.0 International
license.
-
You are free:
- to share – to copy, distribute and transmit the work
- to remix – to adapt the work
-
Under the following conditions:
- attribution – You must give appropriate credit, provide a link to the license, and indicate if changes were made. You may do so in any reasonable manner, but not in any way that suggests the licensor endorses you or your use.