Peak-power-average-power-tau-T.png

Size of this preview:
739 × 600 pixels
.
Other resolutions:
296 × 240 pixels
|
592 × 480 pixels
|
947 × 768 pixels
|
1,034 × 839 pixels
.
Summary
| Description |
English:
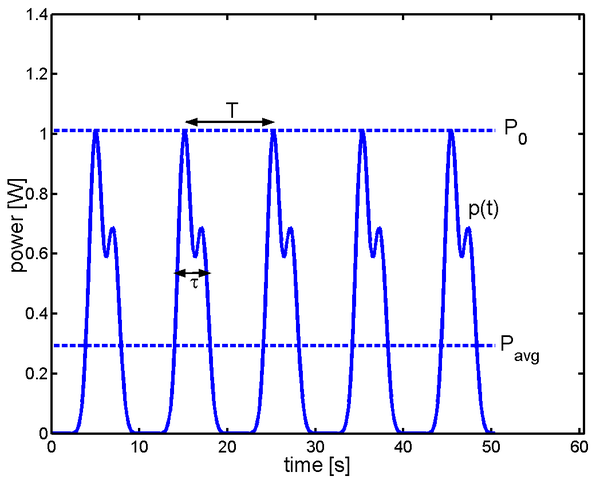
Plot of the instantaneous power p(t) of periodic signal of period T. The peak power and average power are also shown.
is the pulse width (see
Power (physics)
for a definition).
This diagram was created with
MATLAB
.
|
| Date | 22 November 2004 (original upload date) |
| Source | Own work by the original uploader |
| Author | Pgabolde at English Wikipedia |


|
This
graph
image could be re-created
using
vector graphics
as an
SVG
file
. This has several advantages; see
Commons:Media for cleanup
for more information. If an SVG form of this image is available, please upload it and afterwards replace this template with
{{

vector version available

|

new image name

}}
.
It is recommended to name the SVG file “Peak-power-average-power-tau-T.svg”—then the template Vector version available (or Vva ) does not need the new image name parameter. |
Licensing
|
|
This work has been released into the
public domain
by its author,
Pgabolde
at
English Wikipedia
. This applies worldwide.
In some countries this may not be legally possible; if so: Pgabolde grants anyone the right to use this work for any purpose , without any conditions, unless such conditions are required by law. |
Original upload log
Transferred from en.wikipedia to Commons by Premeditated Chaos using CommonsHelper .
The original description page was
here
. All following user names refer to en.wikipedia.
- 2007-10-23 03:52 Omegatron 1034×839× (9953 bytes) cropped [using [[Help:External editors|an external editor]]]
- 2004-11-22 06:34 Pgabolde 1200×900× (12360 bytes) plot of instantaneous power and peak power