Principal_Component_Analysis_of_the_Italian_population.png
Size of this preview:
600 × 600 pixels
.
Other resolutions:
240 × 240 pixels
|
480 × 480 pixels
|
897 × 897 pixels
.
Summary
| Description |
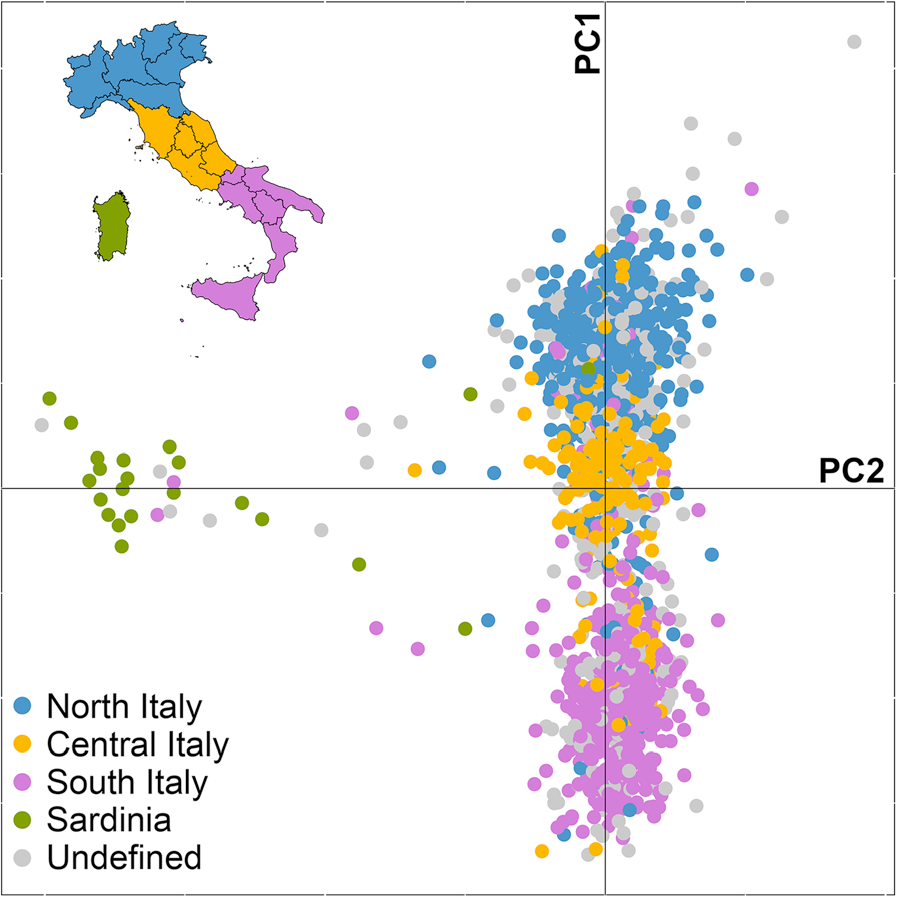
English:
Principal Component Analysis of the Italian population. Plot of the first two principal components calculated on the Italian genotypic dataset. Each individual was labeled according to the color scheme reported in the map in the upper-left corner. The map of Italy was created using the shapefile made available by the Italian National Institute of Statistics (ISTAT;
http://www.istat.it/it/strumenti/territorio-e-cartografia
)
|
| Date | Published: 9 November 2015 |
| Source | Silvia Parolo et al. "Characterization of the biological processes shaping the genetic structure of the Italian population" BMC Genetics201516:132 DOI: 10.1186/s12863-015-0293-x http://bmcgenet.biomedcentral.com/articles/10.1186/s12863-015-0293-x |
| Author | Silvia Parolo, Antonella Lisa, Davide Gentilini, Anna Maria Di Blasio, Simona Barlera, Enrico B. Nicolis, Giorgio B. Boncoraglio, Eugenio A. Parati and Silvia Bione |
| Other versions |


|
Licensing
This file is licensed under the
Creative Commons
Attribution 4.0 International
license.
-
You are free:
- to share – to copy, distribute and transmit the work
- to remix – to adapt the work
-
Under the following conditions:
- attribution – You must give appropriate credit, provide a link to the license, and indicate if changes were made. You may do so in any reasonable manner, but not in any way that suggests the licensor endorses you or your use.