RiemannCriticalLine.svg

Size of this PNG preview of this SVG file:
800 × 372 pixels
.
Other resolutions:
320 × 149 pixels
|
640 × 298 pixels
|
1,024 × 476 pixels
|
1,280 × 595 pixels
|
2,560 × 1,191 pixels
|
933 × 434 pixels
.
W3C-validity not checked.
Summary
| Description |
English:
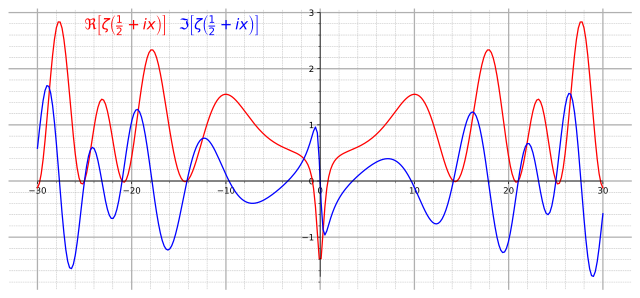
Graph of real (red) and imaginary (blue) parts of the critical line Re(z)=1/2 of the Riemann zeta function.
|
||
| Date | |||
| Source |
Own work. Made with Mathematica using the following code:
Show[Plot[{Re[Zeta[1/2+I x]], Im[Zeta[1/2+I x]]}, {x,-30, 30},AxesLabel->{"x"} , PlotStyle->{Red, Blue}, Ticks->{Table[4x-28,{x,0,14}]}, ImageSize->{800,600}],
Graphics[Text[Style[\[DoubleStruckCapitalR][\[Zeta][ I x + "1/2"]],14,Red ,Background ->White],{-22,2.6} ]],
Graphics[Text[Style[\[GothicCapitalI][\[Zeta][ I x + "1/2"]],14,Blue ,Background ->White],{-14,2.6} ]]]
|
||
| Author | Slonzor | ||
|
Permission
( Reusing this file ) |
Public Domain | ||
| SVG development |
This plot was created with
Matplotlib
by
Krishnavedala
.
|
||
| Source code |
Python code
|
Licensing
|
|
I, the copyright holder of this work, release this work into the
public domain
. This applies worldwide.
In some countries this may not be legally possible; if so: I grant anyone the right to use this work for any purpose , without any conditions, unless such conditions are required by law. |