Social_Security_Worker_to_Beneficiary_Ratio.png
Size of this preview:
800 × 600 pixels
.
Other resolutions:
320 × 240 pixels
|
640 × 480 pixels
|
960 × 720 pixels
.
Summary
| Description |
English:
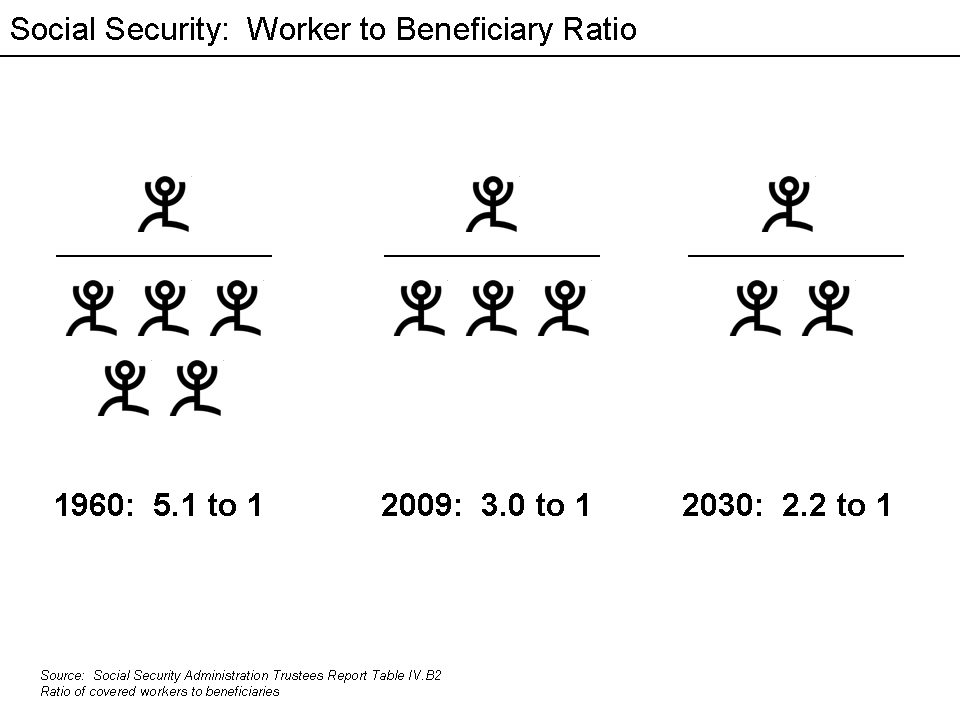
Social Security - Ratio of workers to beneficiaries
ExplanationThe ratio of covered workers (those who pay into the program and will receive benefits) to beneficiaries (those receiving payments) continues to decline as America ages and fertility rates decline. [1] This chart concept was drawn from a slide by the Concord Coalition . An article in The Economist in April 2011 had the overall "support ratio" (the ratio of working age people to those beyond retirement age) at 5.3 in 1970, 4.6 in 2010 and 2.6 in 2050. This decline is happening all over the developed world. [2] |
| Date | (UTC) |
| Source | I ( Farcaster ( talk )) created this work entirely by myself. |
| Author | Farcaster ( talk ) 01:52, 6 May 2011 (UTC) |

|
This
graph
image could be re-created
using
vector graphics
as an
SVG
file
. This has several advantages; see
Commons:Media for cleanup
for more information. If an SVG form of this image is available, please upload it and afterwards replace this template with
{{

vector version available

|

new image name

}}
.
It is recommended to name the SVG file “Social Security Worker to Beneficiary Ratio.svg”—then the template Vector version available (or Vva ) does not need the new image name parameter. |
Licensing
Farcaster
at
English Wikipedia
, the copyright holder of this work, hereby publishes it under the following licenses:
This file is licensed under the
Creative Commons
Attribution-Share Alike 3.0 Unported
license.
Attribution:
Farcaster
at
English Wikipedia
-
You are free:
- to share – to copy, distribute and transmit the work
- to remix – to adapt the work
-
Under the following conditions:
- attribution – You must give appropriate credit, provide a link to the license, and indicate if changes were made. You may do so in any reasonable manner, but not in any way that suggests the licensor endorses you or your use.
- share alike – If you remix, transform, or build upon the material, you must distribute your contributions under the same or compatible license as the original.

|
Permission is granted to copy, distribute and/or modify this document under the terms of the GNU Free Documentation License , Version 1.2 or any later version published by the Free Software Foundation ; with no Invariant Sections, no Front-Cover Texts, and no Back-Cover Texts. A copy of the license is included in the section entitled GNU Free Documentation License . |
You may select the license of your choice.
Original upload log
The original description page was
here
. All following user names refer to en.wikipedia.
| Date/Time | Dimensions | User | Comment |
|---|---|---|---|
| 2011-05-06 01:52 | 960×720× (10209 bytes) | Farcaster | {{Information |Description = Social Security - Ratio of workers to beneficiaries |Source = I (~~~) created this work entirely by myself. |Date = ~~~~~ |Author = ~~~~ |other_versions = }} |