|
Description
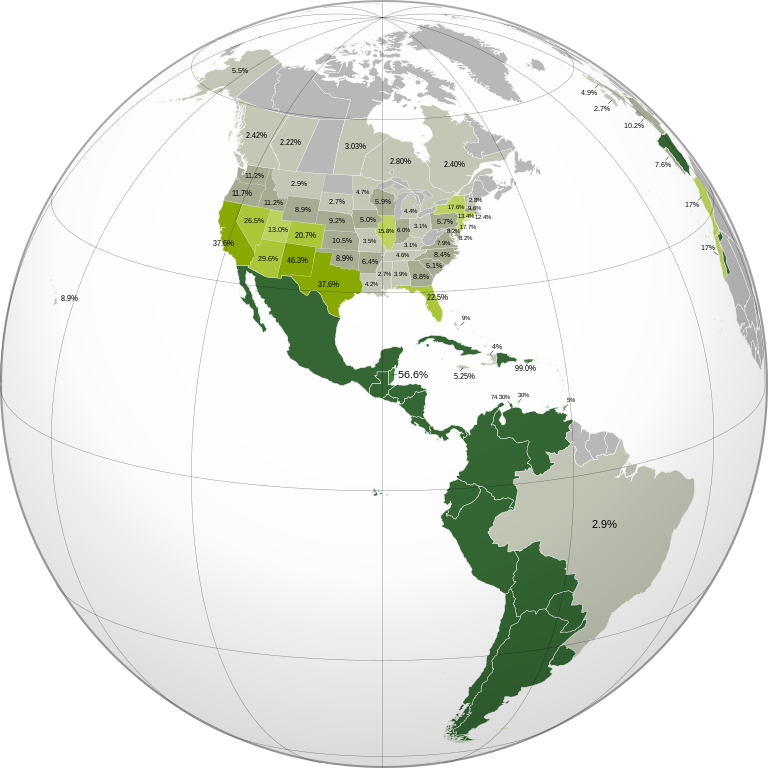
Spanish speakers in the Americas (orthographic projection).svg
|
Español:
Proyección ortográfica de Hispanoamérica y el porcentaje de hispanoparlantes en América.
|
Hispanoamérica
-
México : 115,296,767
[1]
-
Colombia : 46,366,364
[2]
-
Argentina : 41,281,631
[3]
-
Peru : 30,475,144
[4]
-
Venezuela : 28,946,101
[5]
-
Chile : 17,402,630
[6]
-
Ecuador : 15,223,680
[7]
-
Guatemala : 13,824,463
[8]
-
Cuba : 11,163,934
[9]
-
Bolivia : 10,389,913
[10]
-
República Dominicana : 9,445,281
[11]
-
Honduras : 8,249,574
[12]
-
Paraguay : 6,561,748
[13]
-
El Salvador : 6,134,000
[14]
-
Nicaragua : 6,071,045
[15]
-
Costa Rica : 4,301,712
[16]
-
Puerto Rico
: 3,667,084
[17]
-
Panama
: 3,661,868
[18]
-
Uruguay
: 3,318,535
[19]
,
[20]
Países no hispanoparlantes
-
Canadá : 2.37%
-
Estados Unidos : 16.3%
-
Belice : 56.6%
-
Trinidad y Tobago : 10.98%
-
Jamaica : 5.25%
-
Haití : 2.59%
-
Las Bahamas : 3.1%
-
Guyana : 3.0%
-
San Cristóbal y Nieves : 2.6%
-
Santa Lucía : 2.5%
-
San Vicente de las Granadinas : 1.8%
-
Greolandia : 1.8%
-
Surinam : 1.5%
-
Brasil : 2,9% (2016)
[21]
Otros
-
Marruecos : 17%
-
Portugal : 7.6%
-
Francia : 10.2%
-
Reino Unido : 4.9%
-
Irlandia : 2.7%
|
Estados Unidos
Un total de 36,995,602 hispanoparlantes según el Censo 2010 de EE.UU (741,760 gentes de los cuales hablan español en sus hogares)
[22]
-
Nuevo México : 46.3%
-
California : 37.6%
-
Texas : 37.6%
-
Arizona : 29.6%
-
Nevada : 26.5%
-
Florida : 22.5%
-
Colorado : 20.7%
-
Nueva Jersey : 17.7%
-
Nueva York : 17.6%
-
Illinois : 15.8%
-
Connecticut : 13.4%
-
Utah : 13.0%
|
-
Rhode Island : 12.4%
-
Oregón : 11.7%
-
Idaho : 11.2%
-
Washington : 11.2%
-
Kansas : 10.5%
-
Massachusetts : 9.6%
-
Nebraska : 9.2%
-
Washington D. C : 9.1%
-
Hawaii : 8.9%
-
Oklahoma : 8.9%
-
Wyoming : 8.9%
-
Georgia : 8.8%
|
-
Carolina del Norte : 8.4%
-
Delaware : 8.2%
-
Maryland : 8.2%
-
Virginia : 7.9%
-
Arkansas : 6.4%
-
Indiana : 6.0%
-
Wisconsin : 5.9%
-
Pennsylvania : 5.7%
-
Alaska : 5.5%
-
Carolina del Sur : 5.1%
-
Iowa : 5.0%
-
Montana : 4.1%
|
Canadá
Satistique Canada 2011
-
Ontario : 1.5%
-
Columbia Británica : 1%
-
Québec : 1.8%
-
Alberta : 1.3%
|
English:
Orthographic projection of Spanish America and percentage of Spanish speakers in the Americas.
|
Spanish America
-
Mexico
: 115,296,767
[23]
-
Colombia
: 46,366,364
[24]
-
Argentina
: 41,281,631
[25]
-
Peru
: 30,475,144
[26]
-
Venezuela
: 28,946,101
[27]
-
Chile
: 17,402,630
[28]
-
Ecuador
: 15,223,680
[29]
-
Guatemala
: 13,824,463
[30]
-
Cuba
: 11,163,934
[31]
-
Bolivia
: 10,389,913
[32]
-
Dominican Republic
: 9,445,281
[33]
-
Honduras
: 8,249,574
[34]
-
Paraguay
: 6,561,748
[35]
-
El Salvador
: 6,134,000
[36]
-
Nicaragua
: 6,071,045
[37]
-
Costa Rica
: 4,301,712
[38]
-
Puerto Rico
: 3,667,084
[39]
-
Panama
: 3,661,868
[40]
-
Uruguay
: 3,318,535
[41]
,
[42]
Non-Spanish speaking countries
|
United States
In total there were 36,995,602 spanish speakers in 2010 according Census in the United States (12.8% of the total U.S. population who spoke Spanish language at home)
[44]
Canada
Satistique Canada 2011
|
Français :
Projection orthographique de l'Amérique espagnole et pourcentage des hispanophones en Amérique.
|
Amérique espagnole
-
Mexique
: 115,296,767
[45]
-
Colombie
: 46,366,364
[46]
-
Argentine
: 41,281,631
[47]
-
Pérou
: 30,475,144
[48]
-
Venezuela
: 28,946,101
[49]
-
Chili
: 17,402,630
[50]
-
Equateur
: 15,223,680
[51]
-
Guatemala
: 13,824,463
[52]
-
Cuba
: 11,163,934
[53]
-
Bolivie
: 10,389,913
[54]
-
République Dominicaine
: 9,445,281
[55]
-
Honduras
: 8,249,574
[56]
-
Paraguay
: 6,561,748
[57]
-
El Salvador
: 6,134,000
[58]
-
Nicaragua
: 6,071,045
[59]
-
Costa Rica
: 4,301,712
[60]
-
Porto Rico
: 3,667,084
[61]
-
Panama
: 3,661,868
[62]
-
Uruguay
: 3,318,535
[63]
,
[64]
Pays de langue non espagnole
|
Etats-Unis
Au total, il y avait 36 995 602 hispanophones au recensement de 2010 selon des États-Unis (12,8% de la population totale des États-Unis qui parlait espagnol à la maison)
[66]
Canada
Selon Satistique Canada en 2011
:
-
Terre-Neuve-et-Labrador
: 0,1%
-
Île-du-Prince-Édouard
: 0,2%
-
Nouvelle-Écosse
: 0,2%
-
Nouveau-Brunswick
: 0,2%
-
Québec
: 1,8%
-
Ontario
: 1,5%
-
Manitoba
: 0,8%
-
Saskatchewan
: 0,3%
-
Alberta
: 1,3%
-
Colombie Britannique
: 1%
-
Yukon
: 0,5%
-
Territoires du Nord-Ouest
: 0%
-
Nunavut
: 0,1%
|
Português:
Projeção ortográfica da América Hispânica e a porcentagem de falantes nas Américas.
|
América Hispânica
Países oficialmente não falantes
-
Canadá: 2,37%
-
Estados Unidos: 16,3%
-
Belize: 56.6%
-
Trinidade e Tobago: 10,98%
-
Jamaica: 5,25%
-
Haiti: 2,59%
-
As Bahamas: 3,1%
-
Guiana: 3,0%
-
São Cristóvão e Neves: 2,6%
-
Santa Lúcia: 2,5%
-
São Vicente e Granadinas: 1,8%
-
Groenlândia: 1,8%
-
Suriname: 1,5%
-
Brasil: 2,9% (2016)
[87]
Outros
-
Marrocos: 17%
-
Portugal: 7,6%
-
França: 10,2%
-
Reino Unido: 4,,%
-
Irlanda: 2,7%
|
Estados Unidos
Um total de 36 995 602 falantes de espanhol segundo o Censo dos EUA de 2010 (741 760 pessoas (ou 12,8% da população) falam espanhol em casa)
[88]
-
Novo México: 46,3%
-
Califórnia: 37,6%
-
Texas: 37,6%
-
Arizona: 29,6%
-
Nevada: 26,5%
-
Flórida: 22,5%
-
Colorado: 20,7%
-
Nova Jérsei: 17,7%
-
Nova Iorque: 17,6%
-
Illinois: 15,8%
-
Connecticut: 13,4%
-
Utah: 13,0%
|
-
Rhode Island: 12,4%
-
Óregon: 11,7%
-
Idaho: 11,2%
-
Washington: 11,2%
-
Kansas: 10,5%
-
Massachusetts: 9,6%
-
Nebraska: 9,2%
-
Washington, D. C.: 9,1%
-
Havaí: 8,9%
-
Oklahoma: 8,9%
-
Wyoming: 8,9%
-
Geórgia: 8,8%
|
-
Carolina do Norte: 8,4%
-
Delaware: 8,2%
-
Maryland: 8,2%
-
Virgínia: 7,9%
-
Arkansas: 6,4%
-
Indiana: 6,0%
-
Wisconsin: 5,9%
-
Pensilvânia: 5,7%
-
Alasca: 5,5%
-
Carolina do Sul: 5,1%
-
Iowa: 5,0%
-
Montana: 4,1%
|
Canadá
Satistique Canada 2011
-
Ontário: 1,5%
-
Colúmbia Britânica: 1%
-
Quebec: 1,8%
-
Alberta: 1,3%
|
|


.svg)
.svg)
.svg¶ms=019.409500_N_-099.130700_E_globe:Earth_type:camera_type:satellite_region:MX_heading:0.00&language=en)
