Surface_air_temperature_global.jpg
No higher resolution available.

|
This
graph
image could be re-created
using
vector graphics
as an
SVG
file
. This has several advantages; see
Commons:Media for cleanup
for more information. If an SVG form of this image is available, please upload it and afterwards replace this template with
{{

vector version available

|

new image name

}}
.
It is recommended to name the SVG file “Surface air temperature global.svg”—then the template Vector version available (or Vva ) does not need the new image name parameter. |


Summary
| Description |
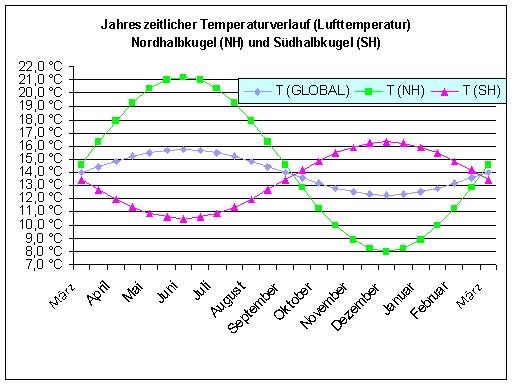
Deutsch:
Quelle:
P. D. Jones et. al.:
SURFACE AIR TEMPERATURE AND ITS CHANGES OVER THE PAST 150 YEARS (Seite 196)
|
| Date | |
| Source | Own work |
| Author | Sandra Burger |
|
Permission
( Reusing this file ) |
I, the copyright holder of this work, hereby publish it under the following license:
This file is licensed under the
Creative Commons
Attribution-Share Alike 3.0 Unported
license.
|