U.S._economic_recovery_scorecard.png

Size of this preview:
800 × 451 pixels
.
Other resolutions:
320 × 180 pixels
|
640 × 360 pixels
|
1,024 × 577 pixels
|
1,408 × 793 pixels
.
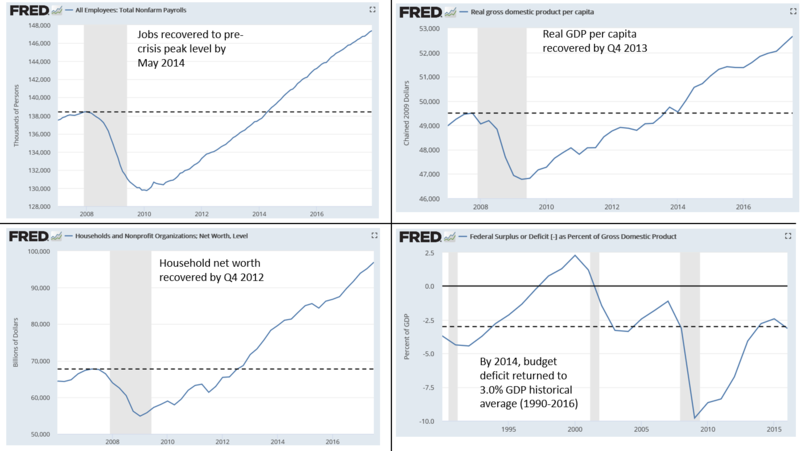
Understanding the chart
The graphic contains several economic data series from the Federal Reserve Economic Data (FRED) along with a dotted line indicating the pre-crisis level or historical average.
- Non-farm payroll jobs [1]
- Real GDP per capita [2]
- Household net worth [3]
- Federal budget deficit as % GDP [4]
References
Summary
| Description |
English:
Several major U.S. economic variables had recovered from the 2007-2009 Great Recession by the 2013-2014 time period.
|
| Date | |
| Source |
Own work , using FRED
|
| Author | Farcaster |
Licensing
|
|
This chart is
ineligible for
copyright
and therefore in the
public domain
, because it consists entirely of information that is common property and contains no original authorship. For more information, see
Commons:Threshold of originality § Charts
|