UK_abortion_by_gestational_age_2004_histogram.svg

| Description |
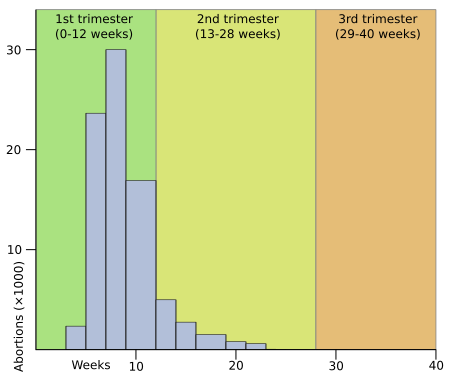
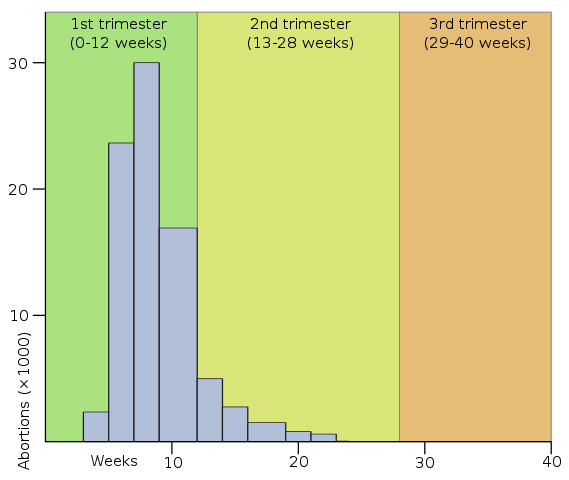
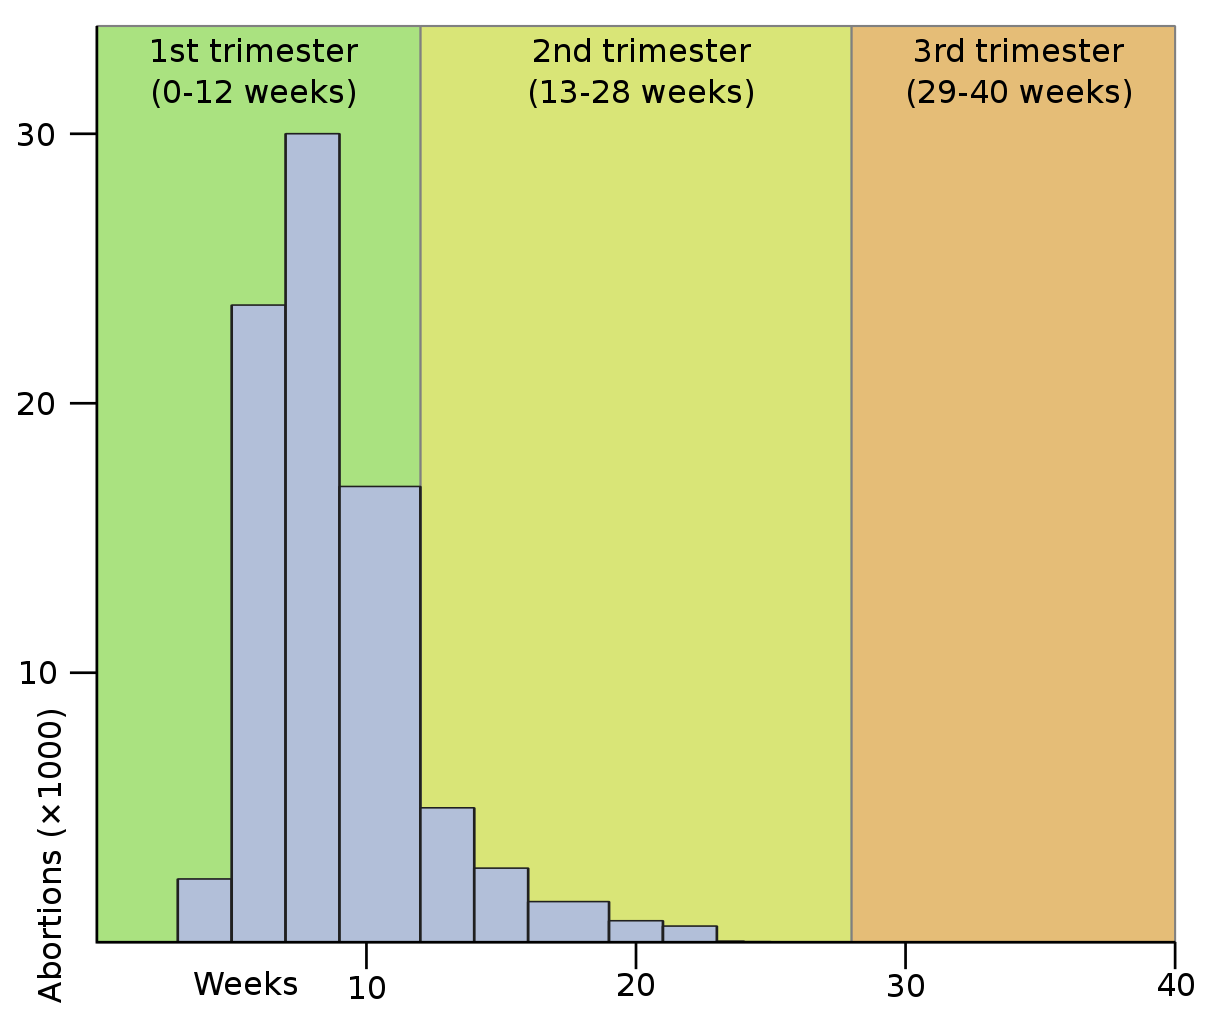
Histogram of abortions by gestational age for England and Wales in 2004. Horizontal axis is weeks and vertical axis is thousands of abortions. Data ( reproduced below ) is taken from Government Statistical Service for the Department of Health. (2005-07-27). Statistical Bulletin - Abortion Statistics, England and Wales: 2004 . Table 5 - Legal abortions: gestation weeks by purchaser, 2004, England and Wales, residents (page 13 of the PDF) Meant to replace File:UKAbortionbyGestationalAgeChart2004.png . A pie chart is a poor way to show this kind of information, and a histogram is better suited to bins of variable width, as presented in the data set. Colors and trimester boundaries are the same as w:Image:Abortionmethods.png for consistency. I did draw the data from 4 weeks out until 40 weeks, but the rectangles are so short they can't be seen. |
||
| Date | |||
| Source |
|
||
| Author | Omegatron | ||
|
Permission
( Reusing this file ) |
I, the copyright holder of this work, hereby publish it under the following licenses:
This file is licensed under the
Creative Commons
Attribution-Share Alike
3.0 Unported
,
2.5 Generic
,
2.0 Generic
and
1.0 Generic
license.
You may select the license of your choice.
|
||
| Other versions |
|


Data
|
Gestation
weeks |
Abortions | /weeks in bin |
|---|---|---|
| 4-5 | 4688 | 2344 |
| 6-7 | 47230 | 23615 |
| 8-9 | 59934 | 29967 |
| 10-12 | 50677 | 16892 |
| 13-14 | 9962 | 4981 |
| 15-16 | 5492 | 2746 |
| 17-19 | 4518 | 1506 |
| 20-21 | 1592 | 796 |
| 22-23 | 1198 | 599 |
| 24 | 41 | 41 |
| 25 | 21 | 21 |
| 26-27 | 20 | 10 |
| 28-31 | 24 | 6 |
| 32+ | 18 | 2 |
| Total | 185415 |
The average gestation for an abortion is thus:
[(4.5)(4688)+(6.5)(47230)+(8.5)(59934)+(11)(50677)+(13.5)(9962)+(15.5)(5492)+(18)(4518)+(20.5)(1592)+(22.5)(1198)+(24)(41)+(25)(21)+(26.5)(20)+(29.5)(24)+(32)(18)]/185415=
[21096+306995+509439+557447+134487+85126+81324+32636+20366+984+525+530+708+576]/185415=
1752239/185415=
9.45 weeks.