Zeta_polar.svg

Size of this PNG preview of this SVG file:
560 × 480 pixels
.
Other resolutions:
280 × 240 pixels
|
896 × 768 pixels
|
1,195 × 1,024 pixels
|
2,389 × 2,048 pixels
.
W3C-validity not checked.
Summary
| Description |
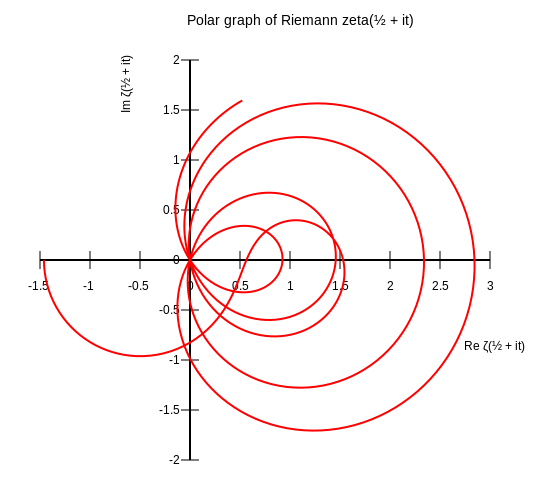
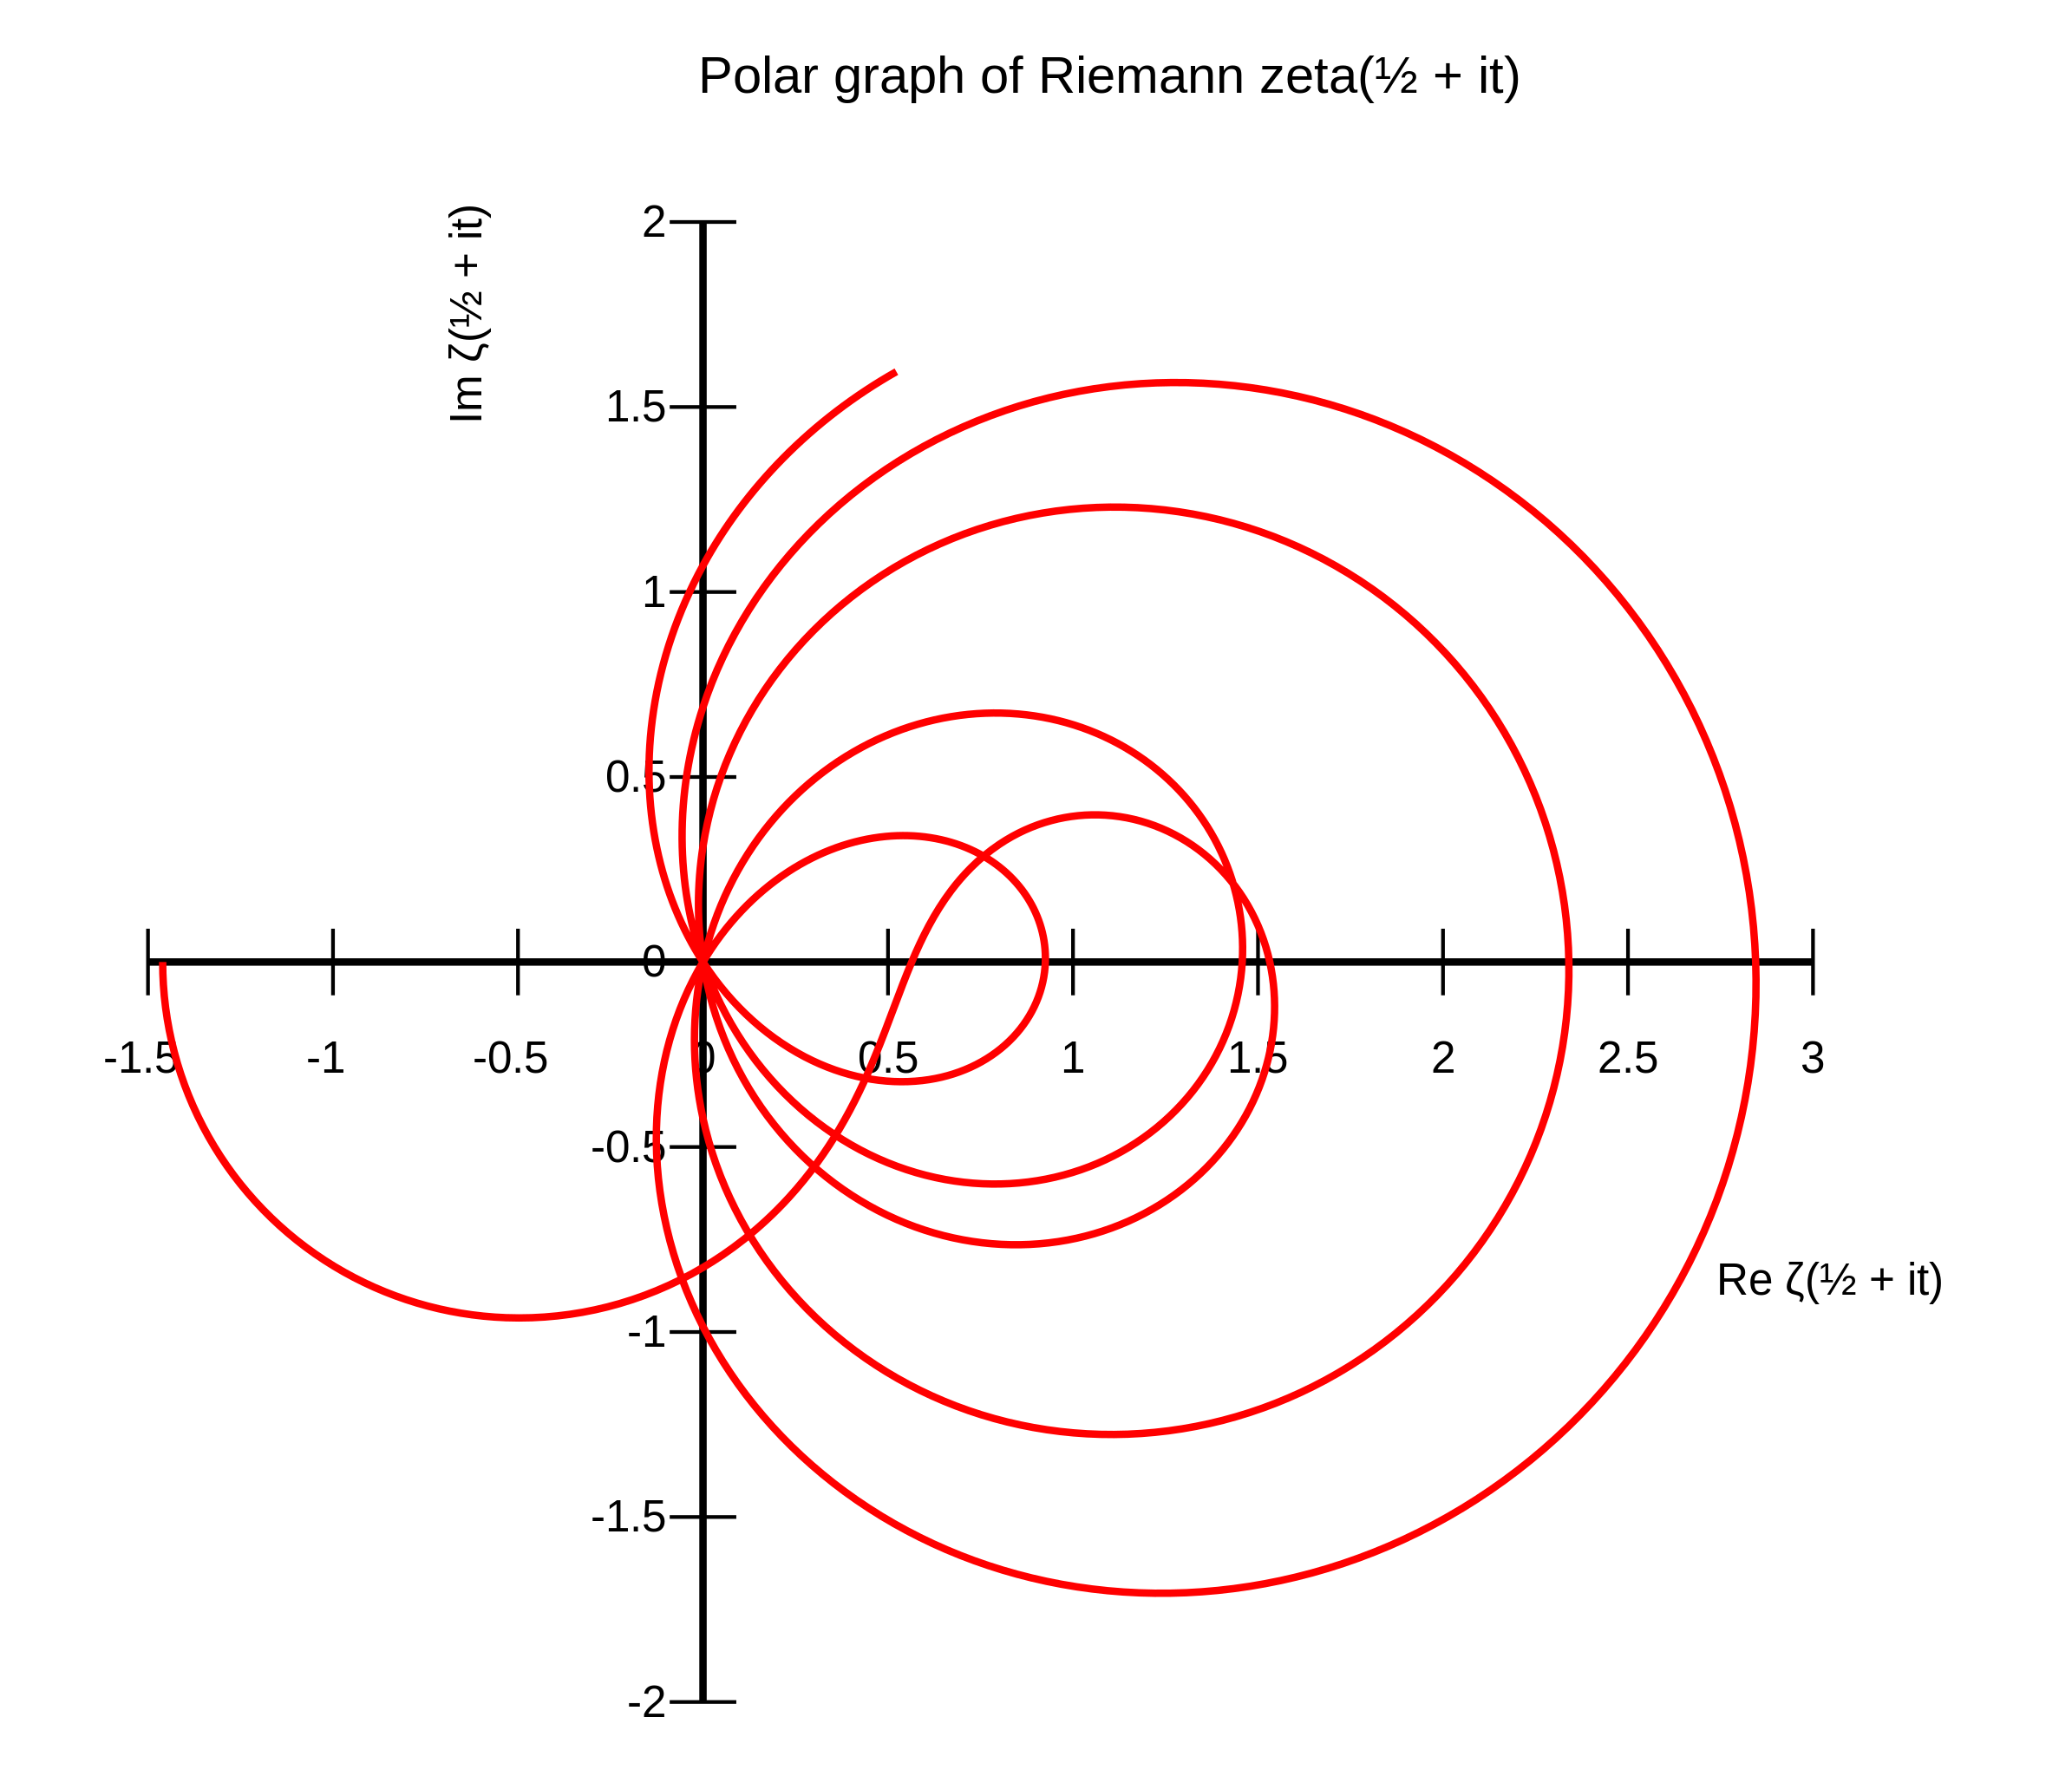
This image shows the
path
of the
Riemann zeta function
along the critical line. That is, it is a graph of
versus
for real values of
t
running from 0 to 34. The first five zeros in the critical strip are clearly visible as the place where the spirals pass through the origin.
|
| Date | |
| Source | http://en.wikipedia.org/wiki/Image:Zeta_polar.svg |
| Author |
|


Licensing

|
Permission is granted to copy, distribute and/or modify this document under the terms of the GNU Free Documentation License , Version 1.2 or any later version published by the Free Software Foundation ; with no Invariant Sections, no Front-Cover Texts, and no Back-Cover Texts. A copy of the license is included in the section entitled GNU Free Documentation License . |
|
|
This file is licensed under the Creative Commons Attribution-Share Alike 3.0 Unported license. | |
|
||
| This licensing tag was added to this file as part of the GFDL licensing update . |